

CGC Math - Paint Me A Picture
This is the second article exploring possible indicators from CGC Census calculations. The first article from June 2021 observed that the average CGC universal grade generally decreases as comic age increases, and average CGC universal grade generally decreases as the number of CGC submissions increases for a given comic. Both factors potentially indicate information related to the supply of books beyond those submitted (thus far) to CGC for grading.
PICTURING THE POPULATION
While the CGC comic book grading process results in values between 0.5 and 10, each collector has different personal definitions for what constitutes “high grade”, “mid grade”, and “low grade” for their collection. These definitions may vary from book to book within a collection, depending upon the age of the comic or the difficulty in obtaining particular grades for a particular book.
Without assigning numeric grades, but as a potentially helpful (but hypothetical) visualization, we can imagine that all copies of a particular comic book (before CGC existed) could be represented by a large circle, where the highest grades are in the center and the lowest grades are on the outside.

As CGC arrived into the hobby, these ungraded copies (all comic books at the time) could be visualized as “awaiting submission” with CGC represented as an event approaching from the left. CGC grading is possible for the majority of comic books in existence, whether they actually are submitted to CGC or not.

Because high grade books are more likely to be submitted to CGC, the visualization should “shift” those high grade books toward the CGC submission line. The initial submissions to CGC would be expected to primarily consist of high grade copies, but also include a few from mid grade and low grade categories.

One problem with this visualization is that the circular shape of the existing population, relative to the CGC grading line, is extremely unlikely. The submissions to CGC would need to increase quite drastically in the first couple of years after CGC opened to the public in January 2000 to create an arc (partial circle) shape. It is possible that the circular (arc) shape on the left edge should be replaced with a gradually increasing shape, or by an irregular (“jagged”) shape reflecting fluctuations in the popularity or demand for CGC graded copies of a comic book.
The visualization has a second problem when it could be supposed that all existing high grade books would be CGC graded at some point (perhaps when half of copies had been graded). It is far more likely that high grade, mid grade, and low grade copies of any comic book will always remain ungraded (not CGC graded). Even copies of the highest valued, highest grade comic books may remain ungraded if the owner chooses.
There is no requirement for a comic book to be CGC graded, though more than 6,000,000 have been CGC graded at this point. In the visualization, the circles being used to represent the grades would need to taper to the right for books of all grades which might still not be CGC graded even when the vast majority of existing copies would have been CGC graded (as shown from the left).

As indicated by this visualization, the majority of CGC graded copies should be relatively high grade for any particular comic book when CGC submissions are low, with respect to the remaining ungraded copies for that book. The average CGC universal grade would also be relatively high at this point. As more CGC grading occurs, an increasing percentage of submissions would be expected from the mid grade and low grade categories and the average CGC universal grade would begin to decrease.

Greater numbers of mid grade and low grade copies are submitted as the CGC Census increases, with this visualization example approaching the half-way point for all existing supply being CGC graded. This series of visualizations aligns well with what is known of average CGC universal submissions from the CGC Census (such as comics from 1962, from prior articles in this series), which decrease the average as the number of submissions increase.

As a reminder, the particular grades associated with “high grade”, “mid grade”, and “low grade” will vary by collector. These categories of descriptions vary for individual books as well, since a recent book with an average CGC universal grade of 9.2 might include CGC 9.2 in “mid grade” (because it is just an average CGC graded copy), while an older comic book may have no copies CGC graded above 9.0. What is average mid grade at 9.2 for one book could be a very high grade (even currently unobtainable) for another book. These visualizations do not assign specific grades, but any comic may be described as “high grade”, “mid grade”, and “low grade”.
A CLOSER LOOK AT THESE PICTURES
The first visualization in this article reflects that approximately one-third of the existing supply for any particular comic book could be described as “high grade”, one-third as “mid grade”, and one-third as “low grade”. Some collectors may consider only 5% worth of “high grade” designation (and it is their right to do so), but generally speaking, the three labels could be visualized as three equal groupings.

The numeric values would vary by comic book, where a particular grade might be “high grade” for one book and “mid grade” for another book but suggesting that three thirds comprise the whole existing supply would still be valid conceptually. This validity may provide insight into the populations on the left and the right of the CGC grading line.

The application of the one-third concept is more complicated than may seem mathematically, because the visualization represents all existing copies of a comic book, not just those CGC graded. Copies which have been CGC graded earliest are primarily high grade compared to the existing supply and represent more than one-third as would be present in a random sample.
The visualization shows the CGC grading line as a point in time, with those books already CGC graded earlier to the left of the line. Notice that when the CGC grading line first reaches the supply, only a small volume of books would have been submitted. This fact is reflected in the growth of CGC grading since opening to the public in January 2000. The total volume of CGC graded books in the first year of CGC grading is equaled in less than one month today.
Each comic book would have its own CGC grading line at different depths (left-to-right) along the visualization. A book which has 4% of the existing supply CGC graded at this point might look like the visualization above, while a book which as 40% of existing supply CGC graded might look like the visualization below. It’s possible that both of these depths (4% and 40%) could be valid today for different books.

In all cases, the shift of the high grade copies toward the CGC grading line significantly alters the calculations which might be performed assuming that one-third of all existing books are in each of the high grade, mid grade, and low grade categories. At the point in time where only 4% of existing books have been CGC graded, perhaps 3% are high grade, 0.75% are mid grade, and 0.25% are low grade, far from the existing supply estimates of one-third (equal numbers) in each category. At the point in time when 40% of all existing copies have been CGC graded, perhaps the numbers are closer to one-third in each category, but it would still be expected that “low grade” is under-represented on the CGC Census when compared to the total existing supply.
These problems are a result of the unknowns in these types of detailed calculations, even when using a simple concept like “thirds” to describe the three parts of the whole, after calculating the average CGC universal grade.
BUT DO THE PICTURES MATCH THE DATA?
The 1962 average CGC universal grades show the decrease as the number of CGC submissions increase. This decrease must also correspond with a decrease in the high grade submissions and an increase in the mid grade and low grade submissions, relative to earlier times in CGC submission history.

More specifically, within the 1962 average CGC universal grade results, Amazing Fantasy #15 represents over 2,500 submissions, and may provide insight into the high grade, mid grade, and low grade descriptors. Allowing approximately one-third in each category (and slightly higher for high grade) would result in the following groupings:
Amazing Fantasy #15 (1962)
High Grade = CGC 9.6 to CGC 4.0 (39% of submissions)
Mid Grade = CGC 3.5 to CGC 2.5 (31% of submissions)
Low Grade = CGC 2.0 to CGC 0.5 (31% of submissions)
Applying these current ranges (high grade = CGC 4.0 and above, mid grade = CGC 3.5 to CGC 2.5, and low grade = CGC 2.0 and below) to the history of the CGC Census for Amazing Fantasy #15 results in:
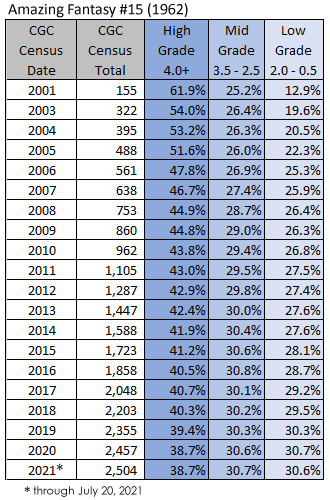
As predicted, the majority of copies CGC graded in the earliest years of CGC are “high grade” (61.9%) and decrease over time (38.7% currently). Regardless of how “high grade” is defined, the starting percentages and the more recent percentages for that definition would show similarly decreasing numbers. Even if it is assumed that 50% of all existing copies of Amazing Fantasy #15 have been CGC graded at this point, these categories for high grade, mid grade, and low grade would be likely to change further if the full supply of surviving copies were known.
Years from now, the high grade category might remain at CGC 4.0 and above, with the existing supply closer to one-third (33%) overall than the 38.7% currently represented on the CGC Census. The percentages for mid grade and low grade would need to rise closer to 33% each, which could widen the range of mid grade from CGC 3.5 to CGC 2.0. Low grade for Amazing Fantasy #15 might settle at CGC 1.8 to CGC 0.5. The current percentages (39%, 31%, and 31%) differ greatly from the early years of CGC submissions (62%, 25%, and 13%, respectively, in 2001).
Creating a visualization as described in this article from these actual numbers for Amazing Fantasy #15 results in the CGC graded (shaded) portion of the graphic:

Each “stairstep” in the graphic (vertical delineation) corresponds to approximately one year of CGC Census data from 2000 to mid-2021. As suspected earlier in the article, the circular shape from the hypothetical visualizations is not a perfect match to the actual CGC Census counts and dates. The increase in CGC submission rates did not occur fast enough to reflect a circular (or arc) shape. To determine whether this new shape visualized by Amazing Fantasy #15 is more indicative of CGC overall, examine the CGC Census totals for the same dates.

The general shape of visualization that should be predicted according to the overall CGC Census totals for 2000 through mid-2021 would be:

Using the overall CGC Census totals for 2000 to mid-2021 to create a similar visualization, Amazing Fantasy #15 (1962) does reflect a more consistent shape to CGC overall totals than the hypothetical circular visualizations would suggest. In a future article from this series, these types of refined visualizations will be examined for a variety of books. Perhaps a pattern (or several patterns) will emerge which provide clues to the remaining supplies of these comic books which would be that unknown portion beyond the CGC grading line.