

Have Comics Been a Good Long-Term Investment?
I once told a financial planner that a large portion of my worth was tied up in comic books. Her response: she shook her head and said, I don’t think that’s very smart. In this article, let’s take a long-term view of comic books and see how they have performed against traditional investments over the years.

At the outset let me acknowledge that (1) I am not a financial planner, (2) past performance of investments does not guarantee future returns, and (3) I’m just a person who is passionate about comic books, invested quite a bit of money, and have been fortunate to buy and hold a few comic books that have performed well over time. On the continuum between a collector who enjoys comics for what they are and a cold-blooded investor, I’m more on the side of a collector—but of course, like most of you, I don’t want to sink thousands of dollars into a comic book only to see the value plummet. I’d prefer to enjoy the comic and see it gain in value.
With respect to evaluating the past long-term investment return of comic books, a first important question to ask is: what is our investment start date?
It’s hard to pin down the exact time when some collectors started thinking of comics as an investment. I’ve heard many say the mid-1960s and some point to the late 1950s. But trying to establish the fair market value of a comic at any point in the ’50s or ’60s is tough. Although there had been some attempts before it, the watershed moment for comic book valuations emerged in November 1970 with the debut of the first Overstreet Price Guide.

And this, too, will be our anchor—the point from which later valuations will be compared. How have comic books performed, and how has this performance compared to other investment vehicles?
Let’s paint the picture of 1970. Richard Nixon was President of the United States. Superman had only been around for 32 years; Spider-Man a mere 8 years. The San Diego Comic-Con debuted early in the year, and Wolverine would not appear in comics until four years later. No doubt, these were early days of comic collecting.
Imagine if you secured the Overstreet Price Guide right when it came out and identified the 31 most valuable comic books. (There were eight books tied for the 24th spot, so the Index contains 31 issues instead of an even 30.) At the time, all of the top comic books were from the 1930s and 1940s. You buy them all in Fine condition for a princely sum of $3,620—which would be about $30,000 in today’s money!
1970 Overstreet Fine-Grade Rankings (Top Issues)
← Scroll left and right to see the full table →
Title / Issue |
Fine 1970 |
Rank 1970 |
|---|---|---|
Action 1 |
$250 |
1 |
Detective Comics 27 |
$225 |
2 |
Marvel 1 |
$200 |
3 |
Superman 1 |
$200 |
3 |
Whiz 1 (#2) |
$185 |
5 |
Batman 1 |
$135 |
6 |
Captain America 1 |
$125 |
7 |
King Comics 1 |
$125 |
7 |
All Star 3 |
$110 |
9 |
All Star 1 |
$100 |
10 |
Captain Marvel Special Edition 1 |
$100 |
10 |
Century of Comics 1 |
$100 |
10 |
Famous Funnies 1 |
$100 |
10 |
Feature Book 25 (Flash Gordon) |
$100 |
10 |
Feature Book 26 (Prince Valiant) |
$100 |
10 |
Flash 1 |
$100 |
10 |
Flash Gordon 10 (Four Color) |
$100 |
10 |
Funnies on Parade 1 |
$100 |
10 |
Mickey Mouse Magazine 1 |
$100 |
10 |
Marvel Mystery 2 |
$100 |
10 |
Single Series 20 |
$100 |
10 |
Walt Disney's Comics & Stories 1 |
$95 |
22 |
Marvel Mystery 9 |
$90 |
23 |
New Comics 1 |
$85 |
24 |
Black & White 5 (Tarzan) |
$85 |
24 |
Captain Marvel Adventures 1 |
$85 |
24 |
Daredevil Comics 1 |
$85 |
24 |
MM3 |
$85 |
24 |
MM4 |
$85 |
24 |
More Fun 1 |
$85 |
24 |
Walt Disney's Comics & Stories 2 |
$85 |
24 |
1970 Overstreet Index Total |
$3,620 |
— |
Your Dow-Jones-like Index can now serve as an indicator for market success. But unlike the actual Dow Jones, we’re not going to adjust this Index every year by throwing out underperforming comics and replacing them with emerging stars. Nope, we’re sticking to our guns.
In your mind’s eye, you believe you’ve made a smart investment. This is a new market. Of course there is some risk, but the upside potential seems high. Most people disagree with your assessment. You could have bought a nice, new 1970 car with that kind of money. Subsequently, you’ve been dumped by your significant other and faced stern disapproval from your parents. Nonetheless, despite protests from loved ones, you persist—for decades—with this conviction.
Fast-forward 55 years to the end of 2025. How has this comic book Index performed? (See the methodology section at the end of this article for more details on how this Index was put together.)
Category / Comparison (1970–2025)
← Scroll left and right to see the full table →
Category / Index |
1970 Value |
2025 Value |
Annualized Return |
|---|---|---|---|
Inflation |
$100 |
$837 |
3.94% |
Dow Jones Industrial Average |
$839 |
$47,716 |
7.62% (~11% with dividends re-invested) |
S&P 500 |
$93 |
$6,850 |
8.12% (~11% with dividends re-invested) |
Gold |
$37 |
$3,395 |
8.56% |
1970 Comic Book Index (Top 31 Issues) |
$3,620 |
$7,873,050 |
15.00% |
For context, I am providing a few benchmarks from which to compare. The first is inflation: $100 in 1970 would be worth approximately $837 today for an annualized inflation rate of approximately 4%. I’ve also included the price of the Dow Jones Industrial Average, the Standard & Poor’s 500 Index, and gold, which have all significantly outpaced inflation with annualized average returns between 7.6% and 8.6%. An important note is that the Dow and S&P have a much higher annualized return if dividends were consistently reinvested; the figure is closer to 11%. But even these impressive results are dwarfed in comparison to the Comic Book Index, which boasts a whopping 15% annualized return rate over the last 55 years.
Similar to the stock indices—where the overall rate of return masks considerable variability of individual stocks within them—so too does the Comic Book Index. Some individual issues clearly outperformed the stock indices (12% or higher), some moderately underperformed stocks (between 4% and 7.5%), while others have underperformed even inflation. We’ll examine each category and draw some conclusions.
The Stable Blue Chips
I isolated the comics that performed better than the stock indices with dividends reinvested (12% annualized return or higher) . In addition, you can see the relative rankings of those issues in 1970 versus today. What’s fascinating is how well the top 10 held up. Seven of the top 10 books in 1970 remain in the top 10 today, with Action Comics #1 and Detective Comics #27 retaining their respective #1 and #2 spots. Think about that! In fact, nine of the ten companies atop the S&P 500 weren’t even created in 1970—Berkshire Hathaway being the lone exception.
Blue Chips: 1970–2025 (Top Issues)
← Scroll left and right to see the full table →
Title / Issue |
Fine 1970 |
Rank 1970 |
Fine 2025 |
Rank 2024 |
Yearly % |
|---|---|---|---|---|---|
Action 1 |
$250 |
1 |
$3,000,000 |
1 |
18.62% |
Detective Comics 27 |
$225 |
2 |
$2,000,000 |
2 |
17.98% |
Marvel 1 |
$200 |
3 |
$400,000 |
4 |
14.82% |
Superman 1 |
$200 |
3 |
$1,000,000 |
3 |
16.75% |
Whiz 1 (#2) |
$185 |
5 |
$225,000 |
10 |
13.79% |
Batman 1 |
$135 |
6 |
$400,000 |
5 |
15.64% |
Captain America 1 |
$125 |
7 |
$225,000 |
7 |
14.60% |
Flash 1 |
$100 |
10 |
$200,000 |
13 |
14.82% |
Marvel Mystery 9 |
$90 |
23 |
$65,000 |
35 |
12.71% |
Captain Marvel Adventures 1 [NN] |
$85 |
24 |
$60,000 |
33 |
12.67% |
Note the main theme running across these books: the list is dominated by first appearances of superheroes and first issues of the same superheroes’ eponymous series. You may have also noticed that the two best performing issues were Action Comics #1 (18.6% annualized return) and Detective Comics #27 (18% annualized return). So despite being the most expensive books in 1970, their appreciation still outpaced all other issues in the Comic Book Index. But there are a few books—outside of the Index—that performed even better. I’ll get back to them later.

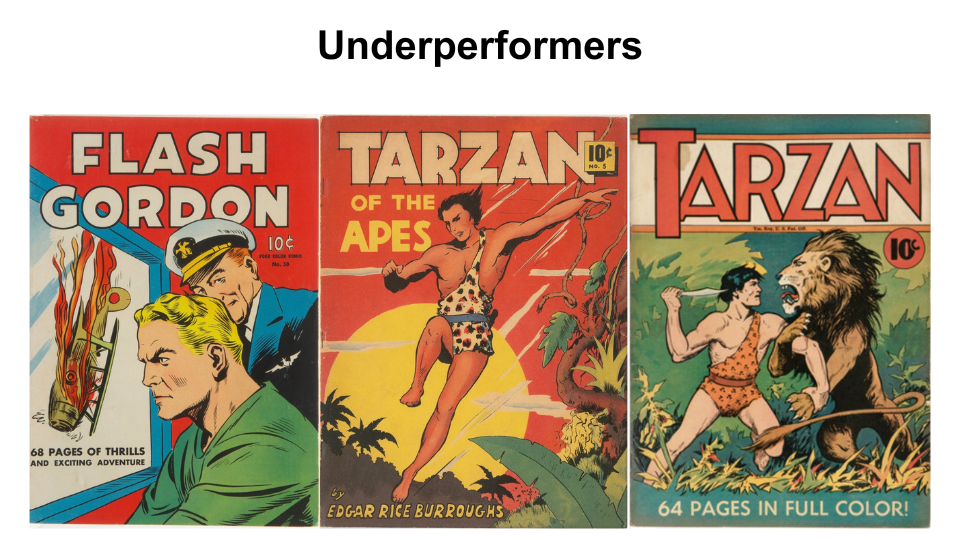
The Underperformers and the Dogs
There are several books that underperformed relative to stocks. These books have also drifted outside of Overstreet’s Top 100 Golden Age comic books of 2024. In other words, if this Index were reset on a yearly basis, they would have long been thrown out. Of the nine underperformers listed below, the three worst-performing books—Flash Gordon 10, Single Series 20, and Black & White 5—failed to even keep up with inflation.
Underperformers and Dogs: 1970–2025
← Scroll left and right to see the full table →
Title / Issue |
Fine 1970 |
Rank 1970 |
Fine 2025 |
Rank 2024 |
Yearly % |
|---|---|---|---|---|---|
All Star 1 |
$100 |
10 |
$5,000 |
>100 |
7.37% |
Captain Marvel Special Edition 1 [Special Edition Comics #1] |
$100 |
10 |
$3,000 |
>100 |
6.38% |
Century of Comics 1 |
$100 |
10 |
$5,000 |
>100 |
7.37% |
Feature Book 25 (Flash Gordon) |
$100 |
10 |
$1,500 |
>100 |
5.05% |
Feature Book 26 (Prince Valiant) |
$100 |
10 |
$1,000 |
>100 |
4.28% |
Flash Gordon 10 (Four Color) |
$100 |
10 |
$550 |
>100 |
3.15% |
Mickey Mouse Magazine #1 |
$100 |
10 |
$2,500 |
>100 |
6.03% |
Single Series 20 |
$100 |
10 |
$800 |
>100 |
3.85% |
Black & White 5 (Tarzan) [Large Feature Comic #5] |
$85 |
24 |
$700 |
>100 |
3.91% |
Not surprisingly, these underperformers are much less familiar to all but the most serious Golden Age collectors. They are often early non-hero books or first/early comic book appearances of characters that originated in other types of media. Tarzan, Prince Valiant, and Flash Gordon apparently do not carry the same cachet today as they did to the collector of 1970.
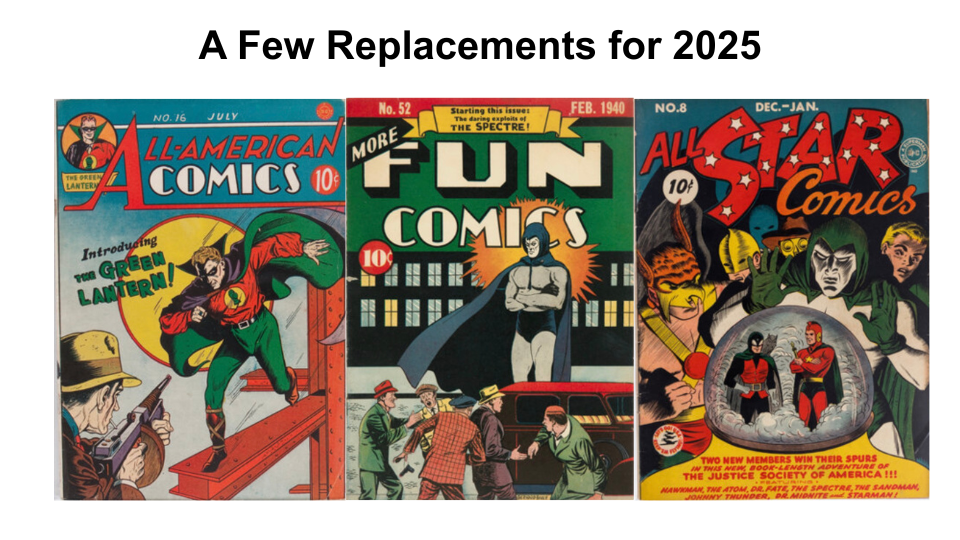
The Replacements
If the Index were re-created today, which comic books would be inserted? A quick method here is to simply look at the 2024 Overstreet Price Guide and determine which comics are now in the Top 31 that were absent in 1970. While the 1970s Top 10 held up well (7 retained), the rest of the Index—not so much. In fact, only two additional issues beyond the Top 10 – Flash 1 and All Star 3 – would be retained in the Top 31. That means there would be 22 replacements.
Replacement Comics for 2025
← Scroll left and right to see the full table →
Title / Issue |
Rank 2024 |
|---|---|
All-American 16 |
6 |
Action 7 |
8 |
Detective 31 |
9 |
Pep 22 |
11 |
Action 10 |
12 |
Tec 29 |
14 |
All Star 8 |
15 |
More Fun 52 |
16 |
Action 2 |
17 |
Detective 33 |
18 |
Wonder Woman #1 |
19 |
Sensation #1 |
20 |
Action 13 |
21 |
Detective 35 |
21 |
Archie 1 |
23 |
Detective 38 |
24 |
Adventure 40 |
25 |
Subby 1 |
26 |
Suspense 3 |
26 |
More Fun 73 |
28 |
Action 3 |
29 |
Detective 1 |
30 |
The group of replacements is dominated by D.C. issues, including a few other first appearances—most notably All-American Comics #16 (Green Lantern), All-Star Comics #8 (Wonder Woman), and More Fun Comics #52 (Spectre). Early Action Comics with Superman on the cover and Detective Comics with Batman on the cover also figure prominently. The biggest non-DC comic on the list is the rare first appearance of Archie in Pep Comics #22.
Out of Nowhere
While Action Comics #1 has had one heck of a run since 1970, at least four other books—have enjoyed even better rates of return. They represent another trend: the rise of classic covers. While still not nearly as valuable as Action Comics #1, they could be bought dirt cheap back in 1970.
High-Growth Outliers (1970–2025)
← Scroll left and right to see the full table →
Title / Issue |
Fine 1970 |
Rank 1970 |
Fine 2025 |
Rank 2024 |
Yearly % |
|---|---|---|---|---|---|
Pep Comics 22 |
$8 |
N/A |
$160,000 |
11 |
19.73% |
Suspense Comics 3 |
$4 |
N/A |
$350,000 |
26 |
22.99% |
Punch Comics 12 |
$3 |
N/A |
$60,000 |
57 |
19.73% |
Chamber of Chills 19 |
$1 |
N/A |
$16,000 |
100 |
19.24% |

A Conclusion (and Note of Caution)
It’s clear that the top comic books have been an incredible investment across the last 55 years, headlined by several issues that have retained their position atop the comic collecting pecking order for decades. Other Golden Age comics—not as coveted in 1970—have also risen in value, like additional early Action and Detective Comics with their stars on the cover as well as superhero-less classic covers.
It would be irresponsible not to mention that some comic books have had less than stellar performance; in fact, some have been duds. Further—and this bears repeating—just because comic books have performed well in the past does not guarantee their future returns.
Perhaps in a future article I will address the cases for why (and why not) comics might continue to be great long-term investments. Further, I think it would be interesting to examine the relative investment performance of comics from different ages (e.g., Golden, Atomic, Silver, Bronze, Copper, and Modern).
For the time being, I wish to salute the early pioneers who developed the comic book community. They invested their time and energy into a medium that was merely a fringe collecting niche, far from what most people would consider a legitimate investment vehicle. Special shout-out to Bob Overstreet, who was the person—more than any other—who helped legitimize the hobby.
Methodology Notes
The intent was to create a Dow-Jones-like Index from the 1970 Overstreet Price Guide.
One of the challenges was deciding which grade to use for the comparison. This was not straightforward, as Overstreet listed prices at three grades: Good, Fine, and Mint. Grading standards were very different and less defined than today, but I felt that the “Fine” designation would be most comparable. Back in 1970, Good books were selling at a relative premium and Mint at a relative bargain compared to today’s pricing. For example, in 1970 Action Comics #1 was listed at $200 in Good condition, $250 in Fine, and $300 in Mint—a spread of x, 1.25x, and 1.5x respectively.
For pricing today, I chose to use GPAnalysis, which is based on actual sales of CGC-graded books, with some extrapolation when recent sales of Fine-equivalent comics weren’t available. Using GPAnalysis, an Action Comics #1 in Good condition might cost about $750,000; a Fine roughly $3,000,000; and a Near Mint perhaps $20,000,000. That’s a spread of x, 4x, and 27x. Today’s Near Mint is also roughly equivalent to how people interpreted Overstreet’s “Mint.” Regardless, I acknowledge that the Fine of 1970 and the Fine of 2025 are not perfectly equivalent.
If I had chosen Good as the standard, the annualized return would have been significantly less. If I had chosen Mint, it would have been much higher. Fine seemed the most reasonable compromise.
Next was selecting which books to include. I combed through the entire 1970 Price Guide by hand and selected the most valuable comic books. Eight comics were tied for the 24th most valuable comic in Fine condition. I didn’t want to exclude any, so the Comic Book Index contains 31 issues instead of 30.
Another peculiarity of this Index is that I let the chosen 31 comics “ride” for all 55 years. I didn’t replace underperformers and I didn’t reweight the issues. As a result, the top seven books represented about 30% of the weighting in 1970 and about 90% in 2025. But that’s what would have happened if someone merely bought and held those comics for 55 years.
Regarding other metrics, I used the closest reputable price data I could find to November 1970 and November 2025. Sometimes the best available data was January 1, 1971, for the 1970 values, but I believe the comparisons are still reasonable approximations.
Keen observers may note that I used the Overstreet 2024 Price Guide for the latest rankings. Unfortunately, the 2025 Overstreet guide has yet to come out. Thus the 2024 Guide was the most recent.
I used the following formula to calculate the annualized return:
(Ending Value / Starting Value)^(1 / 55 years) – 1
Some readers with investment or accounting backgrounds may have more nuanced ways to examine long-term comic book returns, and I welcome their suggestions. Later in December I’ll upload a video on this topic to my YouTube channel and would enjoy hearing your thoughts.
Finally, this article is a more in-depth follow-up to another video I created several years ago on the topic. You can check it out here: https://www.youtube.com/watch?v=yg_NE8XAd7Y
Acknowledgements
Images of comic books are from Heritage Auctions (HA.com)