Top of the stack: 2026 mid-year market briefing
Every two weeks, the CGC comic market spits out a fresh batch of headlines. One fortnight, it’s a record-breaking auction that catches everyone's eye; the next, it’s a sudden surge in a classic key book, or the usual suspect titles dominating trading volume. But while those bi-weekly snapshots are great for a quick pulse check, you don't actually get the real story until you step back and stitch all those frames together.
That’s exactly what we are doing here.
This report pulls together six full months of solid GPAnalysis market data, spanning the reporting period from 30 December 2025 to 29 June 2026, to map out the defining trends of the first half of the year. Instead of getting distracted by isolated outlier sales or a single hyperactive week, we are looking at the complete, macro-level dataset to see how the market actually behaved over time.
By isolating the exact books and publishers that maintained a steady, unwavering baseline of demand, we can spot the long-game trends that are completely invisible when you are only looking at individual fortnight reports. Here are the patterns we are tracking that usually get lost in the day-to-day noise:
Cash Concentration: Where collector dollars actually pooled during the last six months.
The Volume Engines: The specific titles that consistently drove trading activity week in and week out.
Era Battles: How different historical comic eras stacked up against one another in terms of demand.
The Blueprint vs. The Hype: The real relationship between everyday, bread-and-butter market transactions and those massive, headline-grabbing auction hammers.
When you cut through the surface chatter of individual weeks, these core focus areas give us a crystal-clear window into true collector behaviour, market liquidity, and the actual forces shaping the future of the hobby.
Behind the Data: Just to be completely transparent about where these numbers come from, everything in this briefing is pulled directly from GPAnalysis sales data, covering every bi-weekly reporting window between 30 December 2025 and 29 June 2026.
This dataset tracks CGC-graded comic books, magazines, and pulps sold across all the major online marketplaces and auction houses. Unless we explicitly point out an exception, every single stat, chart, and trend we talk about in this report comes straight from this combined six-month data pool.
GPAnalysis.com, sales data recorded from 30 December 2025 to 29 June 2026.
The First-Half of 2026: Market Snapshot
When you stack up all 13 bi-weekly reporting windows between 30 December 2025 and 29 June 2026, the pure scale of the CGC-graded market is staggering. Over those six months of uninterrupted trading activity, the community put up some incredible numbers:
275,205 books moved
That is over a quarter-million comics, magazines, and pulps changing hands and finding new homes on collectors' shelves.
$110,965,821 in Total Sales
A massive, nine-figure sum poured directly into the comic ecosystem, showing just how much capital is actively moving through the hobby.
Median Sale Price ranged from $89 to $101
The median sale price didn't fluctuate wildly; it stayed remarkably steady, hovering between $89 and $101 from period to period. This proves the backbone of the market remains incredibly accessible to the everyday collector.
A jaw-dropping CGC 9.0 sale of $15,000,000
In a historic moment that reminded everyone just how high the ceiling can go, an Action Comics #1 CGC 9.0 (1938) realised a jaw-dropping $15,000,000, easily claiming the title of the highest individual sale of the half-year.
The Undisputed King of Volume moves 17,392 books
To absolutely no one's surprise, Amazing Spider-Man (1963) completely locked down the volume game. It reigned as the single most-traded title in every single reporting period, consistently setting the pace for transaction volume across the entire industry.
Market Observations
Trophy Books Still Own the Headlines (But Not the Market)
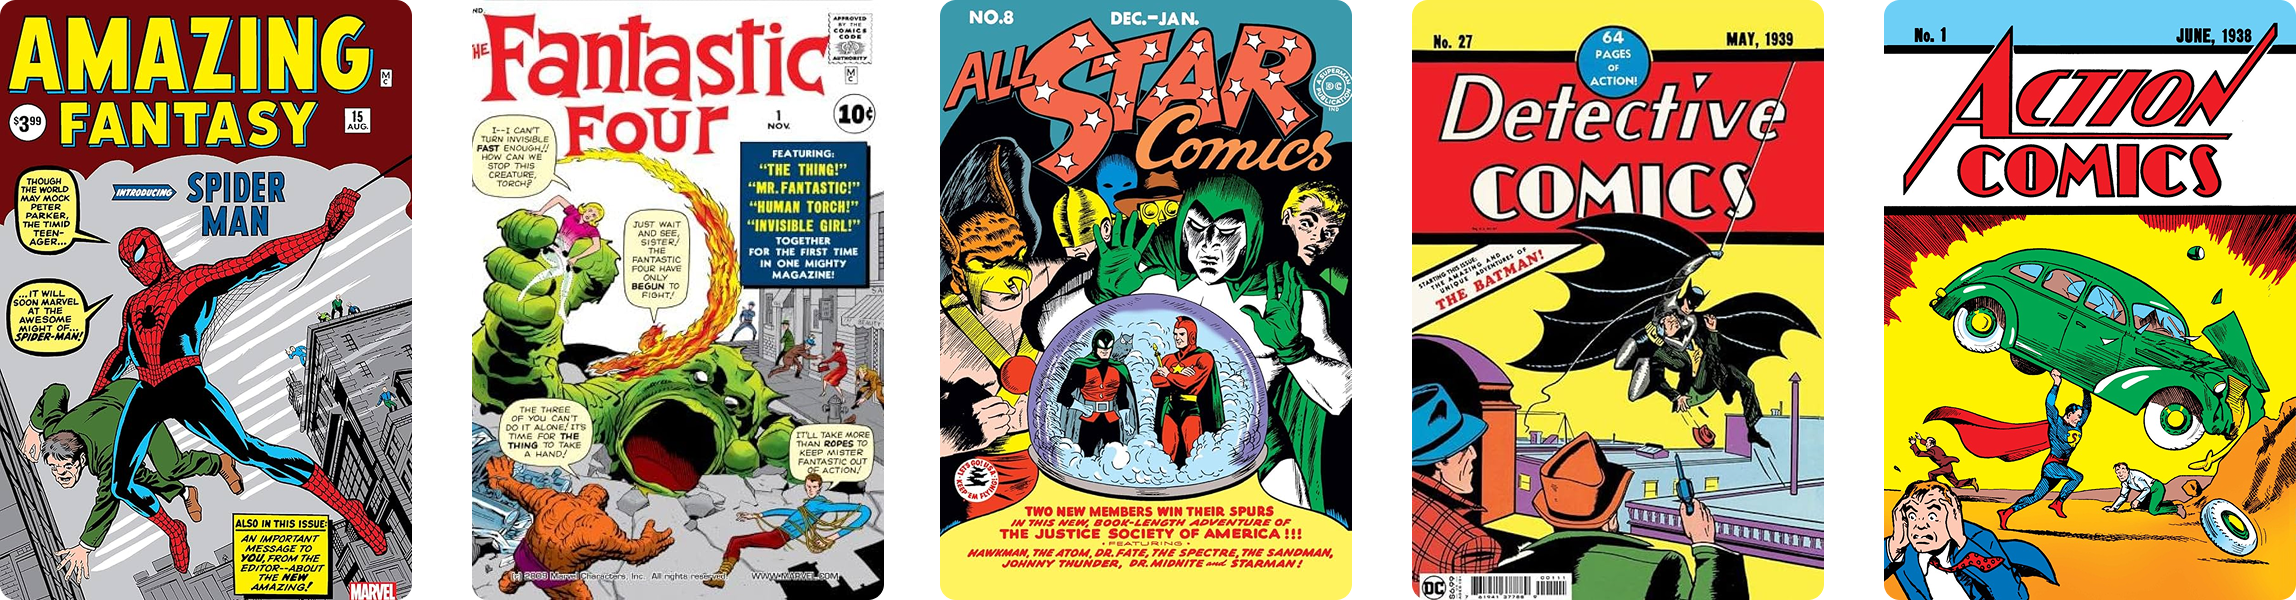
Massive auction results always distort total dollar volume, but they don't actually change how the broader market behaves. Earth-shattering sales like Action Comics #1 ($15.0M), Detective Comics #27 ($2.3M and $1.5M), All-Star Comics #8, Fantastic Four #1, and Amazing Fantasy #15 pushed multiple reporting windows way past the six-month average.
Yet outside these massive outlier transactions, the market kept right on churning out millions of dollars every single fortnight—driven entirely by thousands of everyday collector purchases.

Amazing Spider-Man Remained the Market’s Anchor
No title demonstrated greater consistency than Amazing Spider-Man (1963). It finished as the most-traded title in every reporting period, regularly accounting for well over one thousand certified sales each fortnight. More importantly, it appeared repeatedly among the highest-grossing titles of the 1960s, 1970s, 1980s and 1990s, illustrating a level of demand that few comic series can match. Whether collectors were pursuing Silver Age keys, Bronze Age first appearances or Copper Age favourites, Amazing Spider-Man remained central to market activity.

Bronze and Copper Age Keys Kept Driving Liquidity
The Bronze and Copper eras remain the true volume drivers of this market. Heavy hitters like Amazing Spider-Man #129 and #300, Incredible Hulk #181, Marvel Super Heroes Secret Wars #8, Giant-Size X-Men #1, Wolverine Limited Series #1, and Star Wars #1 constantly dominated the most-traded charts.
Seeing these exact titles pop up week after week tells us exactly what this market is anchored on: highly recognisable, universally loved key issues that collectors just can't stop buying and selling.
The First-Half of 2026: Charting the Trends
Highest Individual Sale by Fortnight
Instead of steady seven-figure sales, this period relied on just three trophy books: the $15M Action Comics #1 and two Detective Comics #27s ($2.318M and $1.525M).
GPAnalysis.com, sales data recorded from 30 December 2025 to 29 June 2026.
Total Books Sold by Fortnight
Everyday collector activity stayed incredibly steady, averaging just over 21,000 books a fortnight. In fact, 10 of the 13 reporting periods fell within a tight range of roughly 21,300 to 22,500 in sales.
GPAnalysis.com, sales data recorded from 30 December 2025 to 29 June 2026.
Total Sales by Fortnight
GPAnalysis tracked $111.0 million in total sales, averaging $8.5 million a fortnight. However, that number is heavily skewed—just three mega-periods locked down 46% of all first-half revenue, supercharged by the $15 million Action Comics #1 and two Detective Comics #27 keys.
Under typical conditions, the median fortnight sat under $6.0 million.
GPAnalysis.com, sales data recorded from 30 December 2025 to 29 June 2026.
Most-Traded Title by Fortnight
Amazing Spider-Man (1963) topped the trading charts in all 13 reporting periods during the first half of 2026. Across those periods, 17,392 CGC-graded copies changed hands, reinforcing its position as the market’s most consistently traded title. While fortnightly volume fluctuated, Spider-Man never relinquished the top spot.
GPAnalysis.com, sales data recorded from 30 December 2025 to 29 June 2026.
Combined Sales of the Top Five Titles by Decade
This chart stacks the top five highest-grossing titles from each decade to show exactly where high-value cash is concentrated. The 1930s absolutely dominate at $21.2 million, driven by those monster hammers from Action Comics #1 and Detective Comics #27.
GPAnalysis.com, sales data recorded from 30 December 2025 to 29 June 2026.
Median Sale Price by Fortnight
The typical price for a comic stayed incredibly stable, ranging tightly between $89 and $101 for the entire half-year. The average median sat around $97, with 10 out of 13 periods holding between $95 and $101.
GPAnalysis.com, sales data recorded from 30 December 2025 to 29 June 2026.
Most Frequently Traded Individual Issues
The most frequently traded books aren't the priciest—they are just incredibly liquid. Staples like Amazing Spider-Man #129 and #300, Star Wars #1, Secret Wars #8, and Incredible Hulk #181 all hit the charts in 11 out of 13 reporting periods.
GPAnalysis.com, sales data recorded from 30 December 2025 to 29 June 2026.
Most Traded Characters and Franchises
Spider-Man completely crushed the recurring lists with 52 appearances—taking up over a third of the chart and nearly doubling the X-Men and Wolverine combo (30 appearances). Together, these two Marvel heavyweights drove almost 60% of the tracked spots.
GPAnalysis.com, sales data recorded from 30 December 2025 to 29 June 2026.
Era Comparison
Combined Sales of the Top Five Titles by Era
Grouping the decades into the four main collecting eras shows exactly where the biggest money pooled. The Platinum and Golden Age crushed it with $31.6 million—taking over half the chart's total value—thanks to those massive Action Comics and Detective Comics outliers.
GPAnalysis.com, sales data recorded from 30 December 2025 to 29 June 2026.
Four Distinct Roles
The market doesn't follow just one model—each era plays a completely different role:
Platinum & Golden Age sets the ceiling: Driven by a few massive landmark sales, making it highly valuable but hyper-sensitive to single auction results.
Silver Age provides depth: Demand is spread across major Marvel titles, delivering a steady, repeatable base of high-value activity.
Bronze & Copper drive liquidity: Recognisable keys change hands constantly, fuelled by accessibility, nostalgia, and steady demand for character.
Modern books offer breadth: Titles like Invincible, Ultimate Fallout, Absolute Batman, and Spawn see steady action, just at lower individual price points.
Bottom line: Golden Age hooks the headlines, Silver brings sustained strength, Bronze keeps the market moving, and Modern broadens everyday participation.
A Resilient, Multi-Speed Market
The first half of 2026 proved that while massive headline auctions steal the spotlight, the market’s true strength lies in steady collector action at every price point.
The hobby is powered by two distinct forces: historic, record-breaking grails at the top, and a deep, active baseline where thousands of keys, first appearances, and modern books change hands every fortnight. Amazing Spider-Man stayed the ultimate volume king, the Silver Age locked down the most value, and the Bronze and Modern eras proved liquidity extends far beyond just the rarest books.
Heading into the second half of the year, these numbers give us a perfect benchmark. The data confirms that the CGC market is broad, resilient, and entirely fueled by enduring collector demand across all eras.
Data sources: The following Top of the Stack articles from The Collector Hub were used to compile this report, covering the period from December 30, 2025, to June 29, 2026. All sales data is sourced from GPAnalysis.
Top of the Stack: Best-Selling CGC Comic Titles by Decade (Dec 30, 2025 – Jan 12, 2026)
Top of the Stack: Best-Selling CGC Comic Titles by Decade (Jan 13–26, 2026)
Top of the Stack: Best-Selling CGC Comic Titles by Decade (Jan 26–Feb 8, 2026)
Top of the Stack: Best-Selling CGC Comic Titles by Decade (Feb 10–23, 2026)
Top of the Stack: Best-Selling CGC Comic Titles by Decade (Feb 24–Mar 9, 2026)
Top of the Stack: Best-Selling CGC Comic Titles by Decade (Mar 10–23, 2026)
Top of the Stack: Best-Selling CGC Comic Titles by Decade (Mar 24–Apr 6, 2026)
Top of the Stack: Best-Selling CGC Comic Titles by Decade (Apr 7–20, 2026)
Top of the Stack: Best-Selling CGC Comic Titles by Decade (Apr 21–May 4, 2026)
Top of the Stack: Best-Selling CGC Comic Titles by Decade (May 5–May 18, 2026)
Top of the Stack: Best-Selling CGC Comic Titles by Decade (May 20–June 2, 2026)
Top of the Stack: Best-Selling CGC Comic Titles by Decade (June 2–June 15, 2026)
Top of the Stack: Best-Selling CGC Comic Titles by Decade (June 16–29, 2026)