How a single copy of Action Comics #1 accounted for almost one-fifth of the CGC-graded comic market’s reported sales in just fourteen days.
Between October 5 and October 18, 2026, collectors purchased 19,091 CGC-graded comics, magazines and pulps across the major sales venues tracked by GPAnalysis. Together, those transactions generated $6,709,282, with a median sale price of $100.
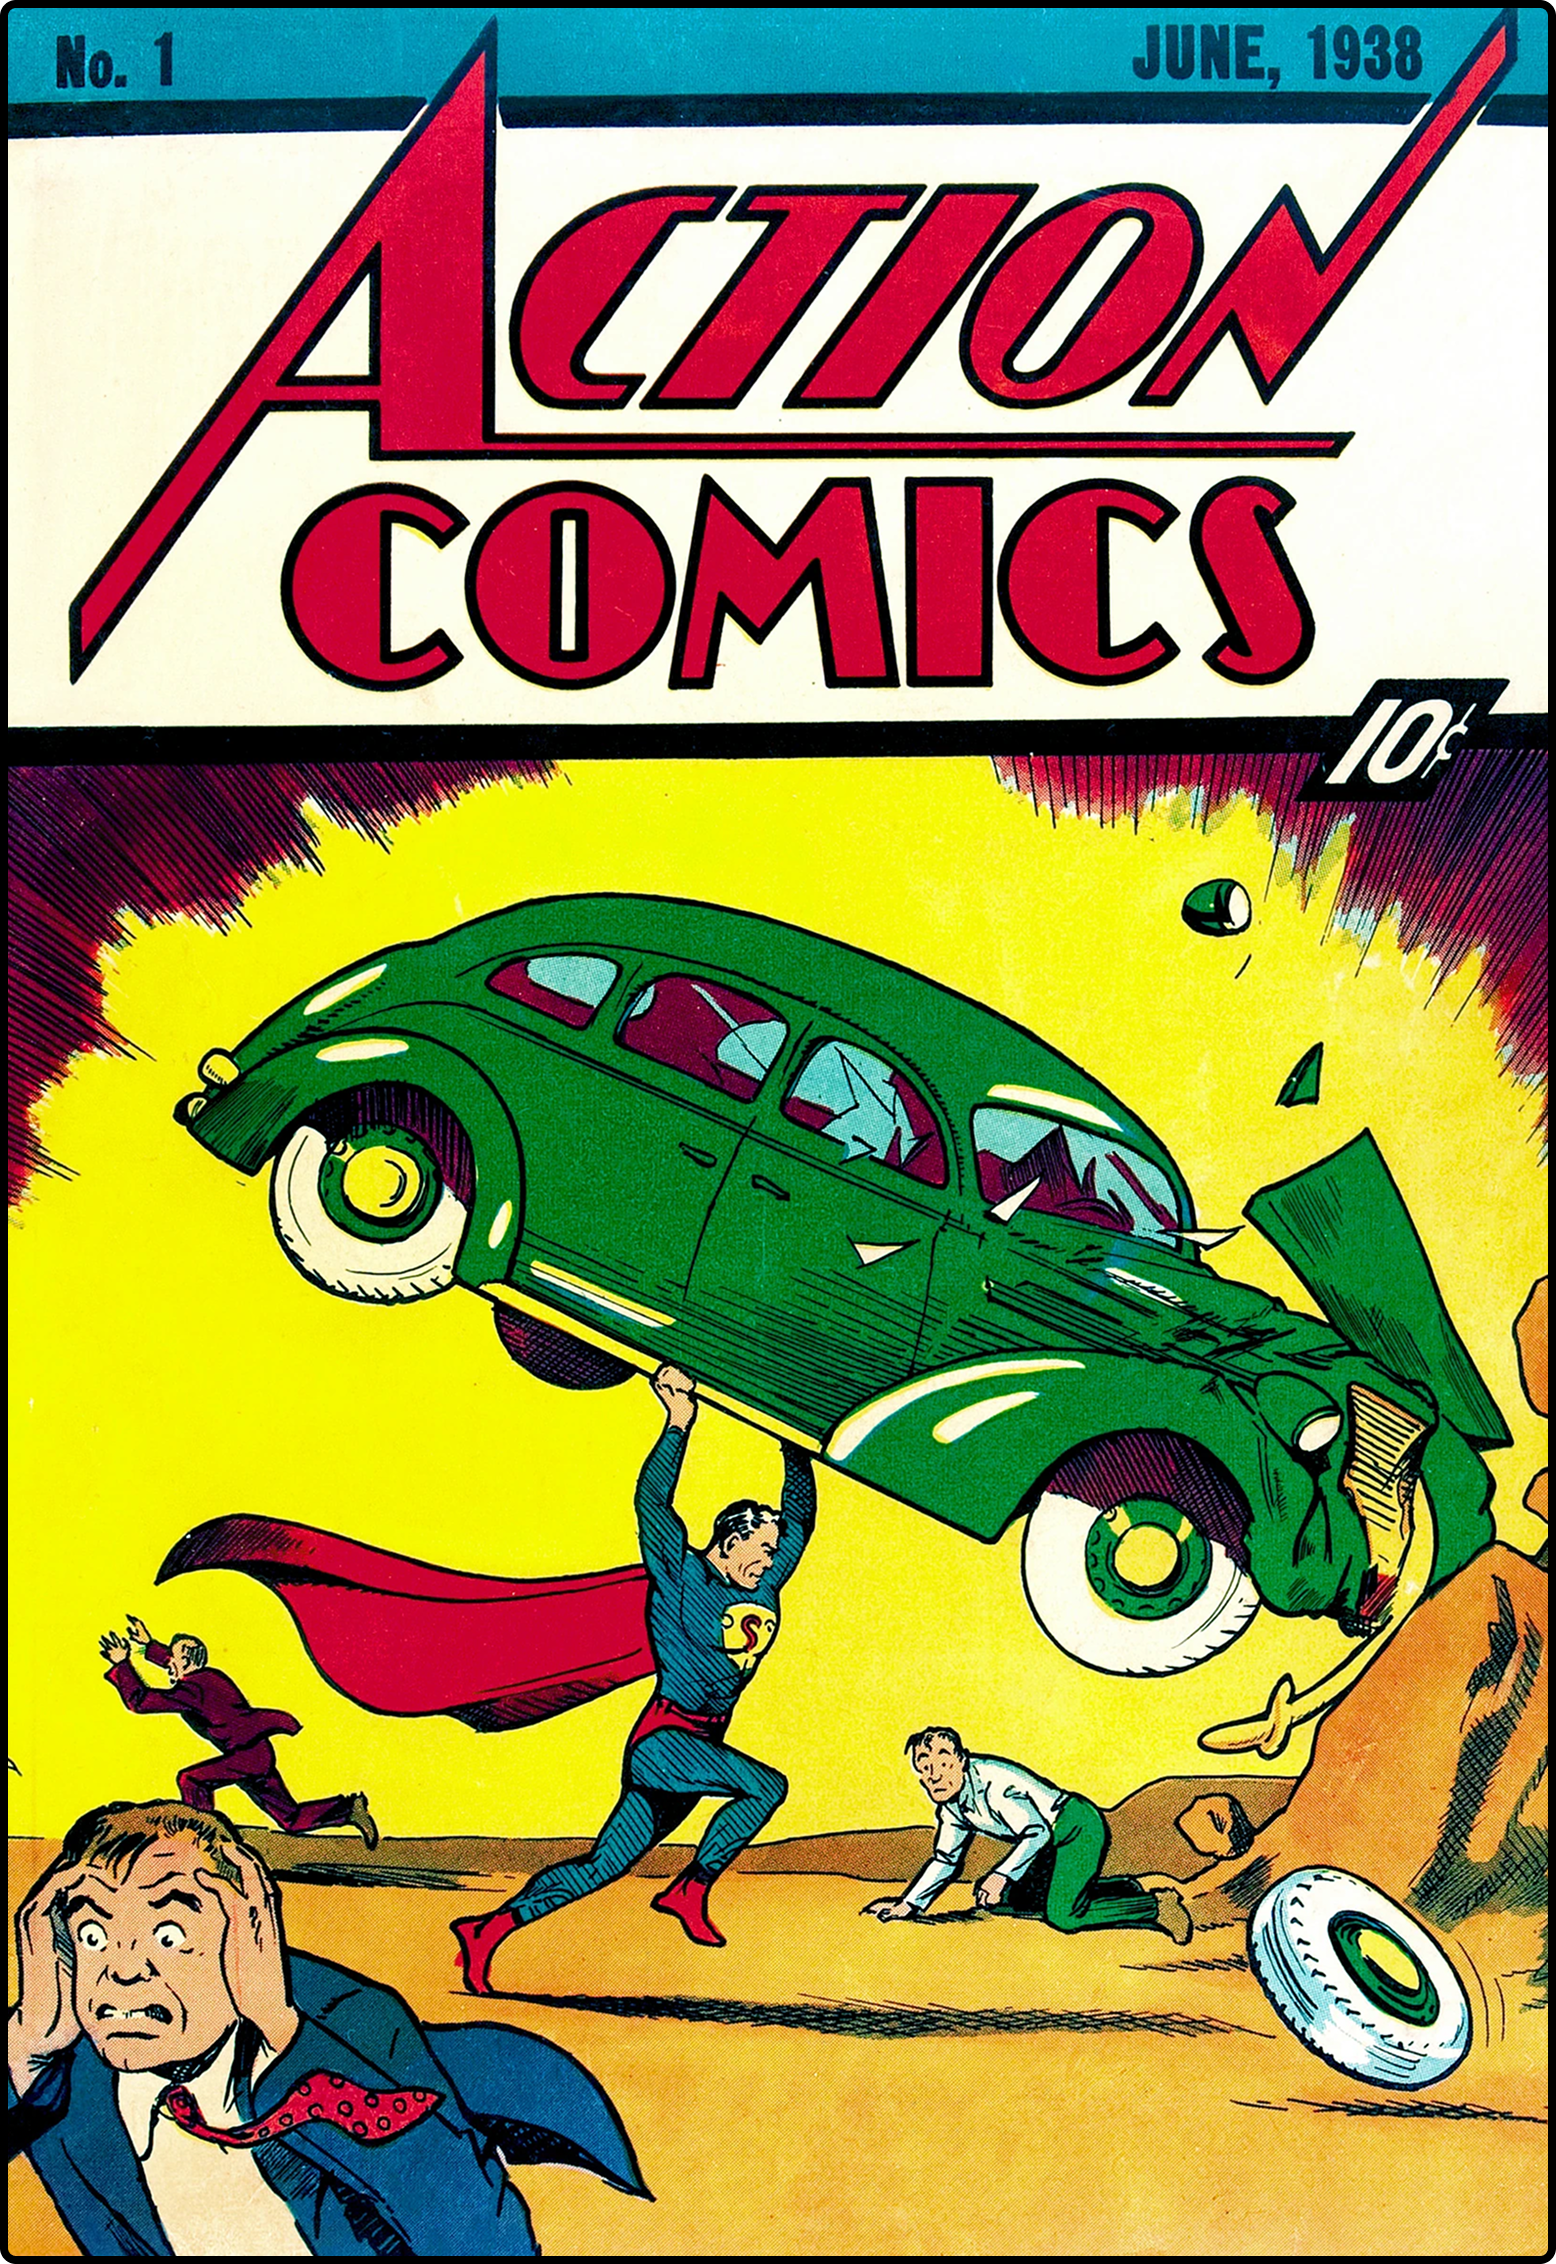
Among those thousands of transactions was one particularly significant sale: a CGC 9.0 copy of Action Comics #1, which sold through ComicConnect.com for $1,300,000.
The 1938 publication that introduced Superman to the world needs little introduction among comic book collectors. Yet this transaction's significance extends beyond the comic itself.
One book accounted for about 19.4% of the fortnight’s total reported sales.
Put another way, a single transaction accounted for almost one dollar in every five spent across the CGC-graded market during those fourteen days.
It’s an extraordinary contrast against the fortnight’s $100 median price, and it raises an interesting question: how much can one exceptional sale shape our understanding of the wider comic book market?
Source: GPAnalysis.com, sales recorded from October 5–18, 2026.
One Sale.
Three Scales.
A single copy of Action Comics #1 sold for $1.3 million. Here's how much that transaction represented at three different levels of the CGC-graded comic market.
Action Comics Sales
1930s Top Five Sales
Entire Fortnight's Sales
One Sale, Two Very Different Markets
The $1.3 million transaction is an important part of the fortnight’s financial story, but it tells us relatively little about the thousands of other books changing hands.
Amazing Spider-Man (1963) remained the most frequently traded title across the reporting period. Collectors purchased 1,231 copies from the series, accounting for approximately 6.4% of all books sold. Those transactions generated approximately $600,000 in reported sales.
That is a substantial contribution from a single title, but it represents a very different kind of activity from the Action Comics #1 transaction.
Amazing Spider-Man generated its sales across more than a thousand individual books. Action Comics #1 generated more than twice that approximate dollar amount through one exceptionally valuable copy. Neither result diminishes the other. They simply demonstrate why trading volume and sales value need to be considered separately.
One tells us which publications collectors buy most often. The other shows where most of the money goes. And occasionally, as this fortnight showed, one transaction's financial influence can exceed that of an entire collection of regularly traded comics.
The 1930s: A Decade Transformed by One Book
The influence of Action Comics #1 becomes even clearer when you examine the decade in which it was published. Across the 1930s, Action Comics generated $1,300,062 in reported title-level sales. Of that amount, the $1.3 million transaction accounted for approximately 99.995%.
The five highest-selling titles from the decade collectively generated $1,324,759, with Action Comics responsible for 98.1% of that total. These figures make the 1930s look extraordinarily strong financially. In fact, the decade produced the largest combined Top Five title sales total of any decade covered in the October 5–18 dataset.
But its trading-volume rankings tell a completely different story.
Weird Tales was the most frequently traded publication from the decade, followed by Shadow, Super Comics, Spicy Adventure Stories and Phantom Detective.
Action Comics did not appear among the five most-traded titles.
That difference is important. The publications generating the most transactions didn't drive the decade’s financial result. Instead, one comic accounted for the overwhelming majority of the money in its Top Five sales rankings. This doesn’t make the result any less significant. A high-grade copy of Action Comics #1 is an exceptional collectable, and a transaction of this magnitude deserves attention.
However, it also means the decade’s financial performance needs to be understood in the context of that single sale. Without recognising its contribution, readers could easily mistake an exceptional transaction for a broader distribution of high-value sales.
Two Decades.
Two Different Stories.
The 1930s generated more sales across their five leading titles, but almost all of that money came from one comic. The 1960s tell a different story, with substantial spending distributed across several major Marvel publications.
1930s
Action Comics dominated the decade's financial result.
Almost the entire Top Five total came from Action Comics, driven by the $1.3 million sale of Action Comics #1.
1960s
Amazing Spider-Man led, with four other titles contributing.
Spending was distributed across several major Marvel titles, with Amazing Spider-Man, Fantastic Four and X-Men each generating more than $160,000.
The 1930s generated the larger Top Five sales total, but the 1960s showed a much broader distribution of spending across their leading titles.
What Happens When the Money Is Spread Across More Titles?
The 1960s provide an interesting comparison. Across its five highest-selling titles, the decade generated $889,317 during the same reporting period. Unlike the 1930s, when almost all the money came from Action Comics, the 1960s saw substantial contributions from several titles.
Amazing Spider-Man led with $363,474, followed by Fantastic Four at $186,809 and X-Men at $162,144. Together, those three titles accounted for approximately 80.1% of the decade’s combined Top Five sales. Although Amazing Spider-Man led financially, it accounted for far less than the concentration seen in the 1930s.
Fantastic Four, X-Men, Avengers, and Amazing Fantasy all contributed meaningfully to the decade’s financial total. This creates two very different pictures. The 1930s generated $1,324,759 across its five highest-selling titles, but almost all of it came from one exceptional transaction. The 1960s generated $889,317 across its five highest-selling titles, with the money distributed across several established Marvel publications.
The first illustrates the financial influence of an exceptionally valuable comic. The second illustrates substantial spending spread across multiple titles. Both are significant, but they tell different stories about what's happening.
Why the Median Price Still Matters
Against these extraordinary figures, the fortnight’s $100 median price provides another useful perspective. Despite the $1.3 million Action Comics transaction and the millions generated over the reporting period, the median sale stayed at $100.
That means half of the recorded transactions sold for $100 or less, and half sold for $100 or more. The median helps put the headline sales into context because it isn't disproportionately influenced by exceptionally expensive transactions the way an average can be.
A $1.3 million comic can contribute enormously to total sales without substantially changing the middle transaction's price. For collectors, that distinction is useful.
The market's financial performance cannot be understood solely through its most expensive books. Equally, the median price doesn't show how much money goes to exceptional collectables. Both measures contribute to the wider picture, but neither fully represents the market.
The Difference Between a Big Sale and a Broad Market
The October 5–18 reporting period clearly shows that large financial totals can emerge in very different ways.
A single exceptional comic can contribute millions of dollars to reported sales. A frequently traded publication can generate substantial revenue through hundreds or thousands of individual transactions. An entire decade can also produce meaningful financial activity spread across several competing titles. These differences matter most when comparing collecting periods or interpreting financial rankings within individual decades.
The 1930s had the largest combined Top Five title sales total in this dataset, but Action Comics #1 drove that result. The 1960s demonstrated a different pattern, with substantial spending distributed across several major Marvel titles. Meanwhile, Amazing Spider-Man remained the most frequently traded publication across the entire fortnight, despite the financial attention commanded by the $1.3 million sale. None of these observations contradicts one another. They simply reveal different aspects of the same market.
The most expensive comic isn’t necessarily the most frequently traded, and the decade generating the most money isn’t necessarily the one with the broadest distribution of spending.
For collectors following the CGC-graded market, that is perhaps the most important lesson from this fortnight. The headline sale deserves its attention. But understanding the market means looking beyond it.
Explore the Complete Market Data
This analysis draws on GPAnalysis sales data from October 5–18, 2026. For the full picture, explore our accompanying Top of the Stack: Best-Selling CGC Comic Titles by Decade report, featuring the five most-traded titles, five highest-selling titles and five most-traded individual issues from every decade between the 1930s and 2020s.
Discover which comics collectors traded most often, where the most money was spent, and how results varied across ten decades of publishing history.