The Market Through the Ages: Where Collector Dollars Were Really Going

Tracking comic sales decade by decade gives a sharp snapshot of which specific eras are pulling in collector capital. Step back and group those decades into their broader historical ages, though, and the entire landscape reshuffles.
During the August 11–24, 2026 reporting window, the 1960s comfortably led every individual decade, with its top five titles hauling in an impressive $775,433.
Yet when you roll the full eras together, the Silver Age doesn't take the ultimate crown. The Bronze Age grouping ends up with that top spot.
Collector Spending by Era
This chart pools the five highest-selling titles from each decade into their broader comic book era groupings. Dataset pooled during the August 11–24, 2026 reporting period.
$2.69M
combined Top Five sales across all era groupings
Bronze Age
$920,256
The 1970s and 1980s combined to produce the largest era total, with only $9,678 separating the contribution of the two decades.
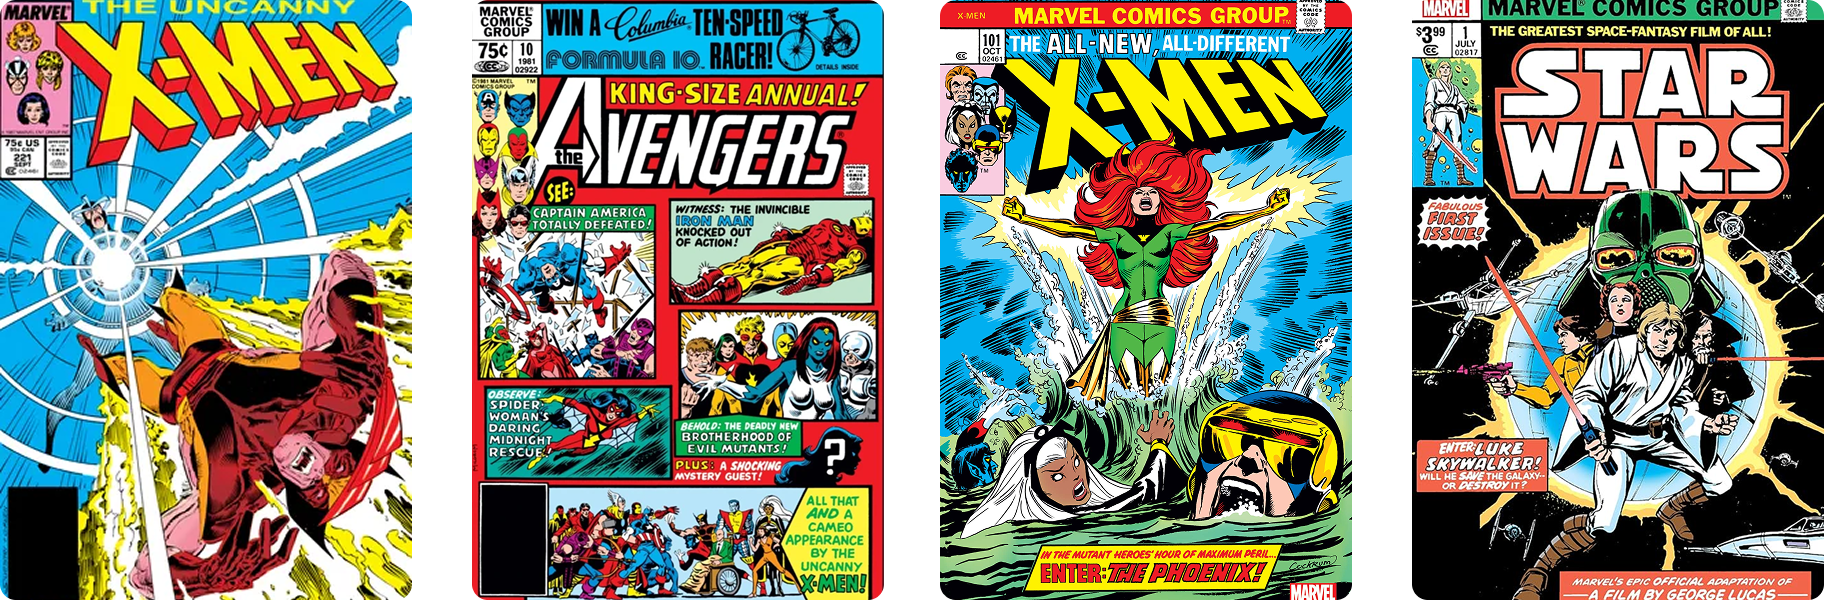
Bronze Takes the Lead
When you bundle the top five highest-grossing titles from the 1970s and 1980s together, the combined tally hits a massive $920,256.
What makes that number even more striking is how cleanly the two decades split the bill:
The 1970s: $455,289
The 1980s: $464,967
A razor-thin margin of just $9,678 separates the two eras.
Instead of one runaway decade propping up the other, collector capital was distributed with near-perfect symmetry across the entire timeline. That gives the Bronze Age grouping a completely different structural profile compared to other eras in the ledger.
Its dominance isn't a flash in the pan; it's genuine, balanced staying power sustained across twenty full years of collecting.
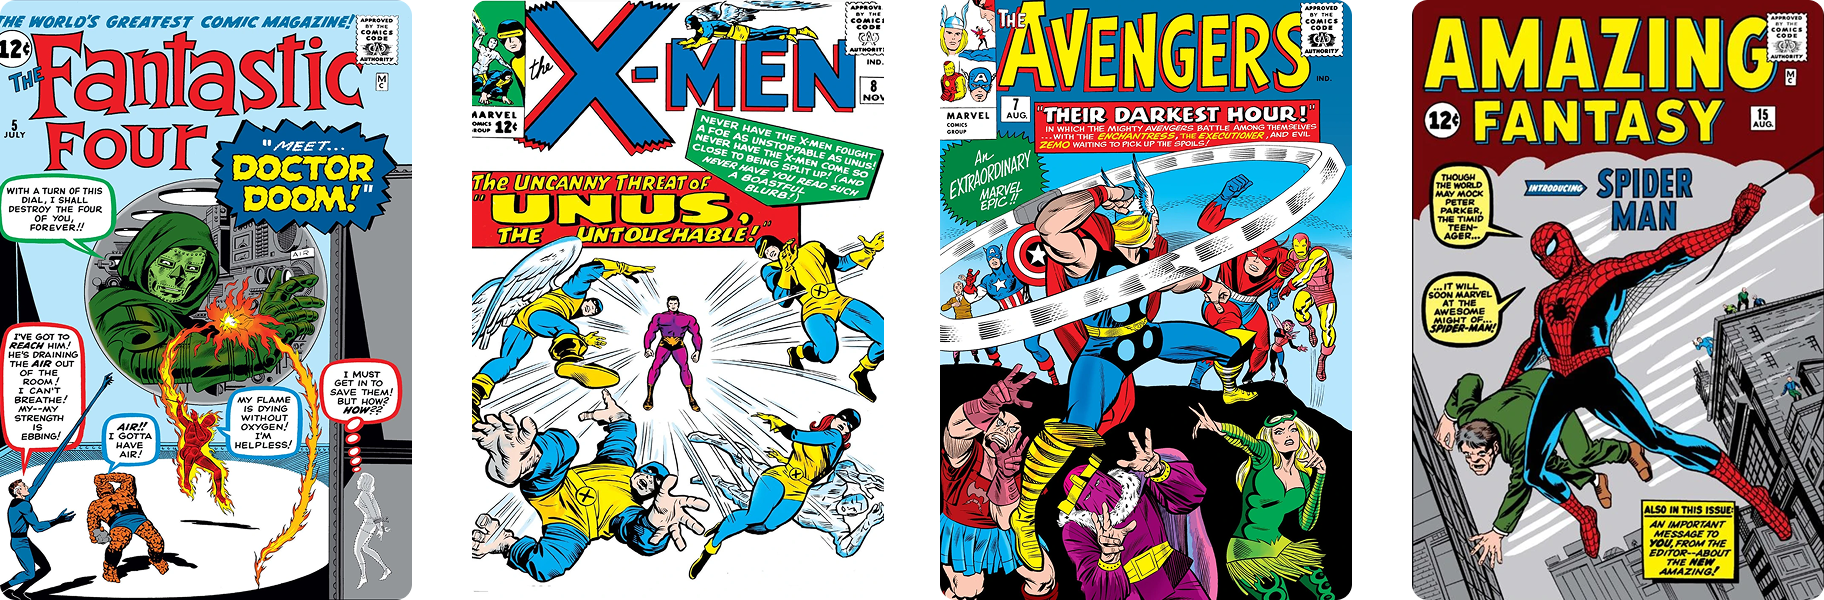
Silver Is Smaller - But Far More Intense
The Silver Age claims the runner-up spot with $775,433.
Unlike the Bronze grouping, though, every single dollar of that total came from a single, high-powered ten-year stretch: the 1960s.
The heavy hitters driving that total are absolute juggernauts:
Amazing Spider-Man: $253,262
Fantastic Four: $200,368
X-Men: $142,788
Avengers: $98,364
Amazing Fantasy: $80,651
That leaves the Silver Age at about $144,800 behind the combined Bronze Age total, an incredible showing, considering it had only one decade pulling all the weight.
So while Bronze takes the crown on pure aggregate volume, the Silver Age remains the single most concentrated, high-dollar powerhouse on the entire board when measured decade for decade.
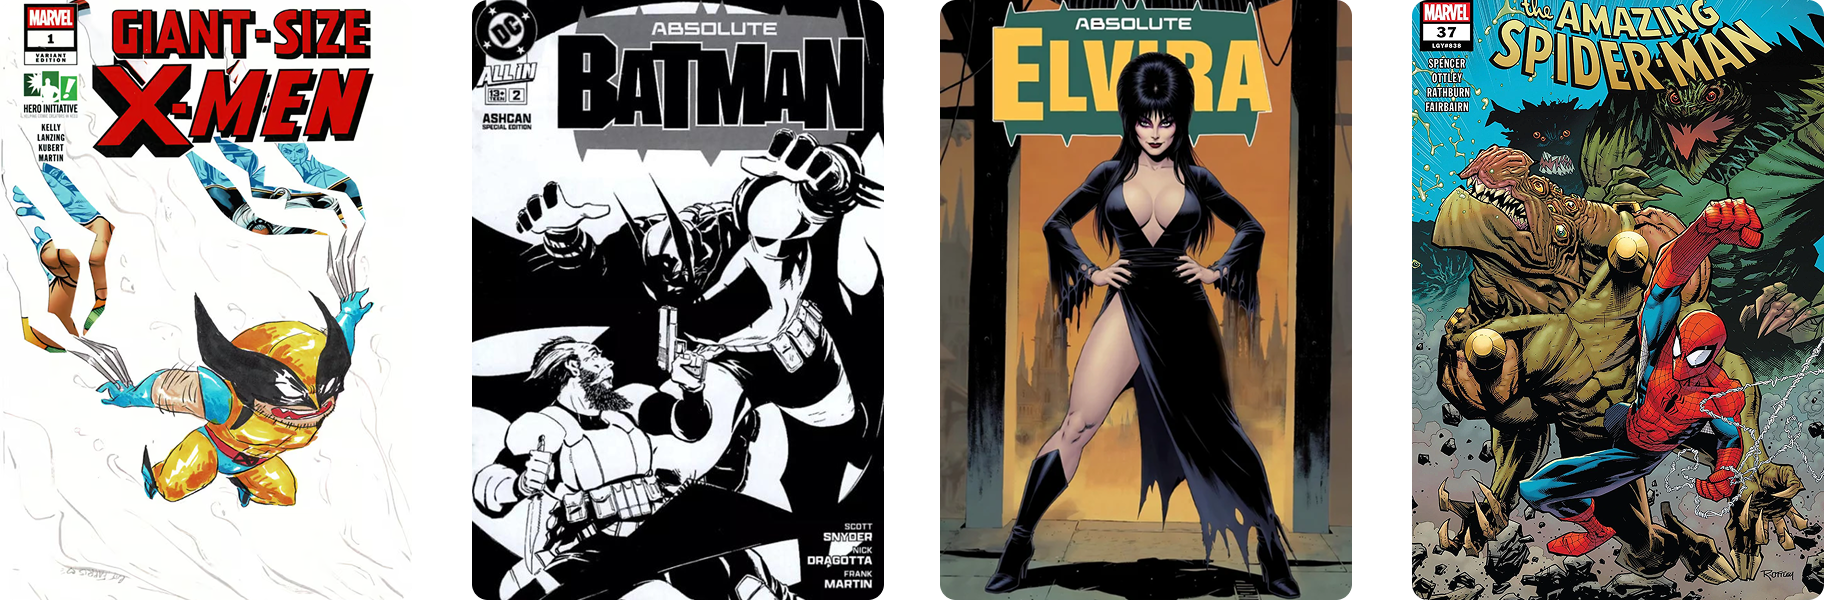
Modern Is Broader Than It First Appears
The Modern grouping, spanning the 1990s through the 2020s, generated a combined $648,561 across its top five title rankings, locking in third place overall.
Look beneath that top-line number, though, and the four underlying decades couldn't look more distinct from one another:
The 1990s: $190,411
The 2000s: $73,855 (a steep drop)
The 2010s: $96,613 (a modest rebound)
The 2020s: $287,682 (a massive surge)
That recent run means the 2020s alone account for roughly 44% of all top-tier Modern sales in the pool.
What's more, a huge portion of that current momentum rests on the shoulders of one runaway property: Absolute Batman, which drove $207,878 all on its own. That gives our current decade a drastically more top-heavy profile than the far more balanced, widespread activity seen in the 1990s.
The Modern market isn't a steady, predictable baseline. It’s a rollercoaster that dips, levels out, and then rockets upward again in the present day.

Platinum and Golden Age: Smaller Numbers, Different Economics
Pooling the 1930s, 1940s, and 1950s together yields $347,214, the smallest total among the four major eras.
When you look at vintage books, though, raw dollar comparisons only tell part of the story. Early material operates under completely different supply constraints and market mechanics:
The 1930s: $33,198 across its top five titles
The 1940s: $169,165 (a massive jump)
The 1950s: $144,851
As the earlier numbers showed, that 1950s figure was heavily distorted by that single $85,400 hammer price for Sports Illustrated #25 CGC 8.5.
Strip out that one transaction, and the entire Golden and Platinum Age baseline shifts dramatically downward. It's a clear reminder of how vintage, low-volume eras behave: when high-grade scarcity meets big money, a single trophy sale can reshape the financial profile of several decades combined.
Four Eras, Four Very Different Blueprints
When you step back and look at the pooled eras together, four completely distinct market personalities emerge:
The Bronze Age claims the top spot for overall size, driven by a remarkably balanced demand split almost down the middle between the 1970s and 1980s.
The Silver Age stands as the ultimate single-decade powerhouse, racking up $775,433 on the sheer strength of the 1960s alone.
The Modern Age delivers the clearest comeback narrative, with an explosive surge in the 2020s hauling the broader multi-decade total sharply upward.
The Platinum and Golden Age group has the smallest footprint among the top five sales, leaving it far more vulnerable to swings from isolated, high-dollar trophy sales.
Across the entire dataset, the top five title rankings generated a massive $2.69 million in combined sales.
The pie breaks down with a fascinating balance:
Bronze Age: ~34% of total capital
Silver Age: ~29%
Modern Age: ~24%
Platinum & Golden Age: ~13%
Looking Beyond the Decade
The real value of zooming out to an era-level view is that it completely changes how we define a "winning" market.
Look strictly at individual decades, and the 1960s easily claim the top spot for this reporting window. Yet, when two deeply productive decades join forces, the Bronze Age grouping surges right past it to take the overall crown.
At the same time, the Modern grouping proves that newer books shouldn't be dismissed as mere low-value filler. The 2020s alone generated more top-five sales revenue than the entire 1930s, 1940s, and 1950s did individually.
What we're seeing is that different eras attract collector capital through fundamentally different engines:
Some through depth across decades.
Some through untouchable, iconic keys.
Some through explosive, concentrated hype around contemporary hits.
And some through the sheer gravity of an isolated trophy sale massive enough to tilt the entire board.
When you only track decade-by-decade charts, those behaviours can look like random, disconnected spikes. But when you pull back and look at broader eras, the market's true architecture finally snaps into focus.