The Biggest Market Isn’t Always the Most Concentrated

Which corner of the comic market showed the most muscle over the latest fortnight?
The intuitive answer is the 1960s. Tally up the five highest-grossing titles across each era between August 11–24, and the Silver Age easily leaves the rest of the board in the dust.
Its top five titles alone pulled in a staggering $775,433. The nearest contender, the 1980s, trailed far behind at $464,967.
Look beneath the raw dollar totals, though, and a very different question emerges: rather than just tracking where the heaviest capital landed, how reliant was each decade on its single biggest performer?
Ask that, and the entire landscape suddenly shifts.
Market Depth vs. Concentration
This chart compares each decade’s combined Top Five title sales with the share generated by its highest-selling title. Dataset pooled during the August 11–24, 2026 reporting period.
$775,433
largest Top Five market — 1960s
1960s
$775,433
The 1960s generated the largest combined Top Five sales total in the dataset, but spending was relatively distributed, with Amazing Spider-Man accounting for 32.7%.

The 1960s Were Big and Broad
Amazing Spider-Man paced the 1960s with $253,262 in total sales, an undeniable powerhouse figure.
What really catches your eye, though, is the heavy-hitting bench sitting right behind it:
Fantastic Four: $200,368
X-Men: $142,788
Avengers: $98,364
Amazing Fantasy: $80,651
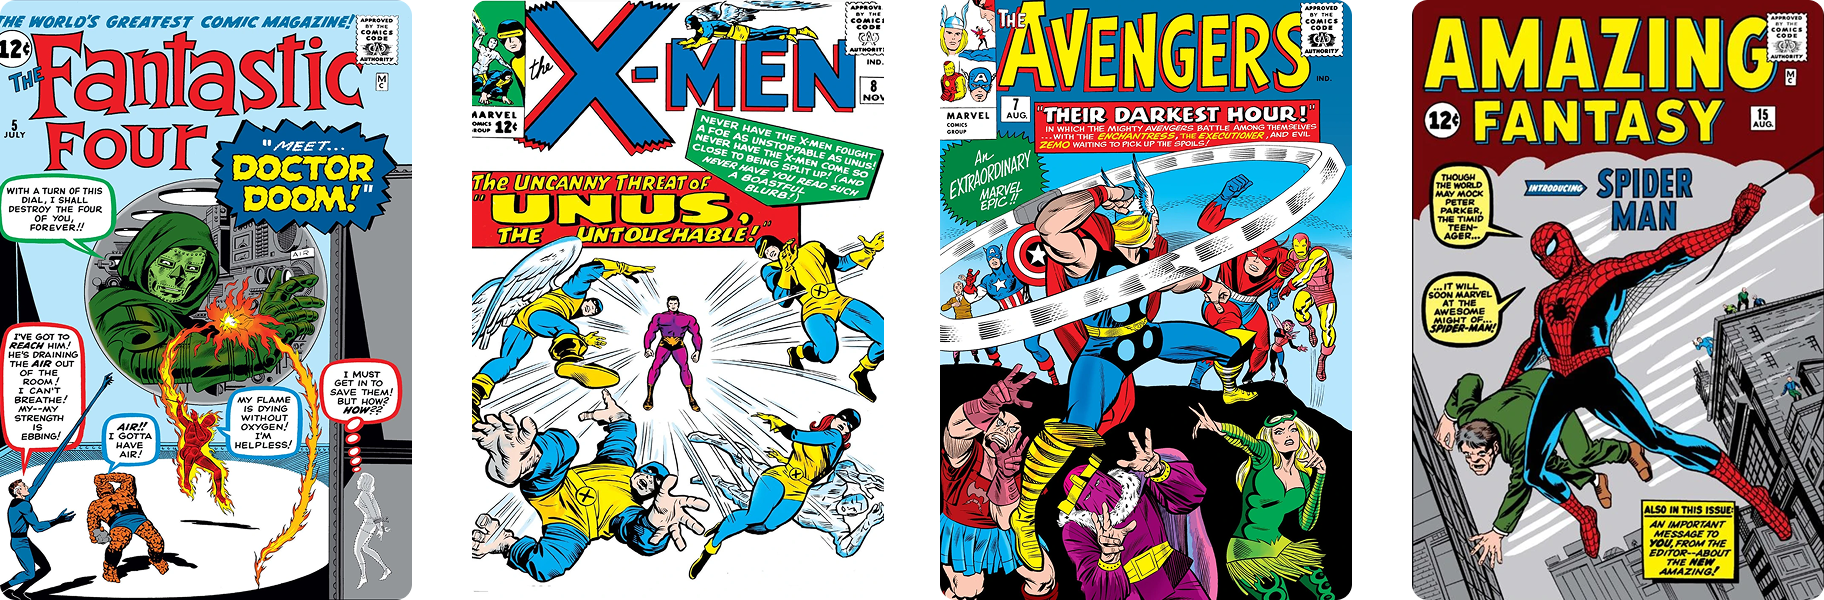
Because of that strong supporting cast, Amazing Spider-Man made up only 32.7% of the $775,433 generated by the decade's top five performers.
The other four titles accounted for a whopping 67.3% of total spend. That tells us we aren't looking at an era being propped up on the shoulders of one lone series. It’s a genuinely healthy, deep market with serious collector capital spreading across multiple pillars.
Now Look at the 2020s
The 2020s generated $287,682 across its five leading titles, a total that isn't even in the same ballpark as the 1960s.
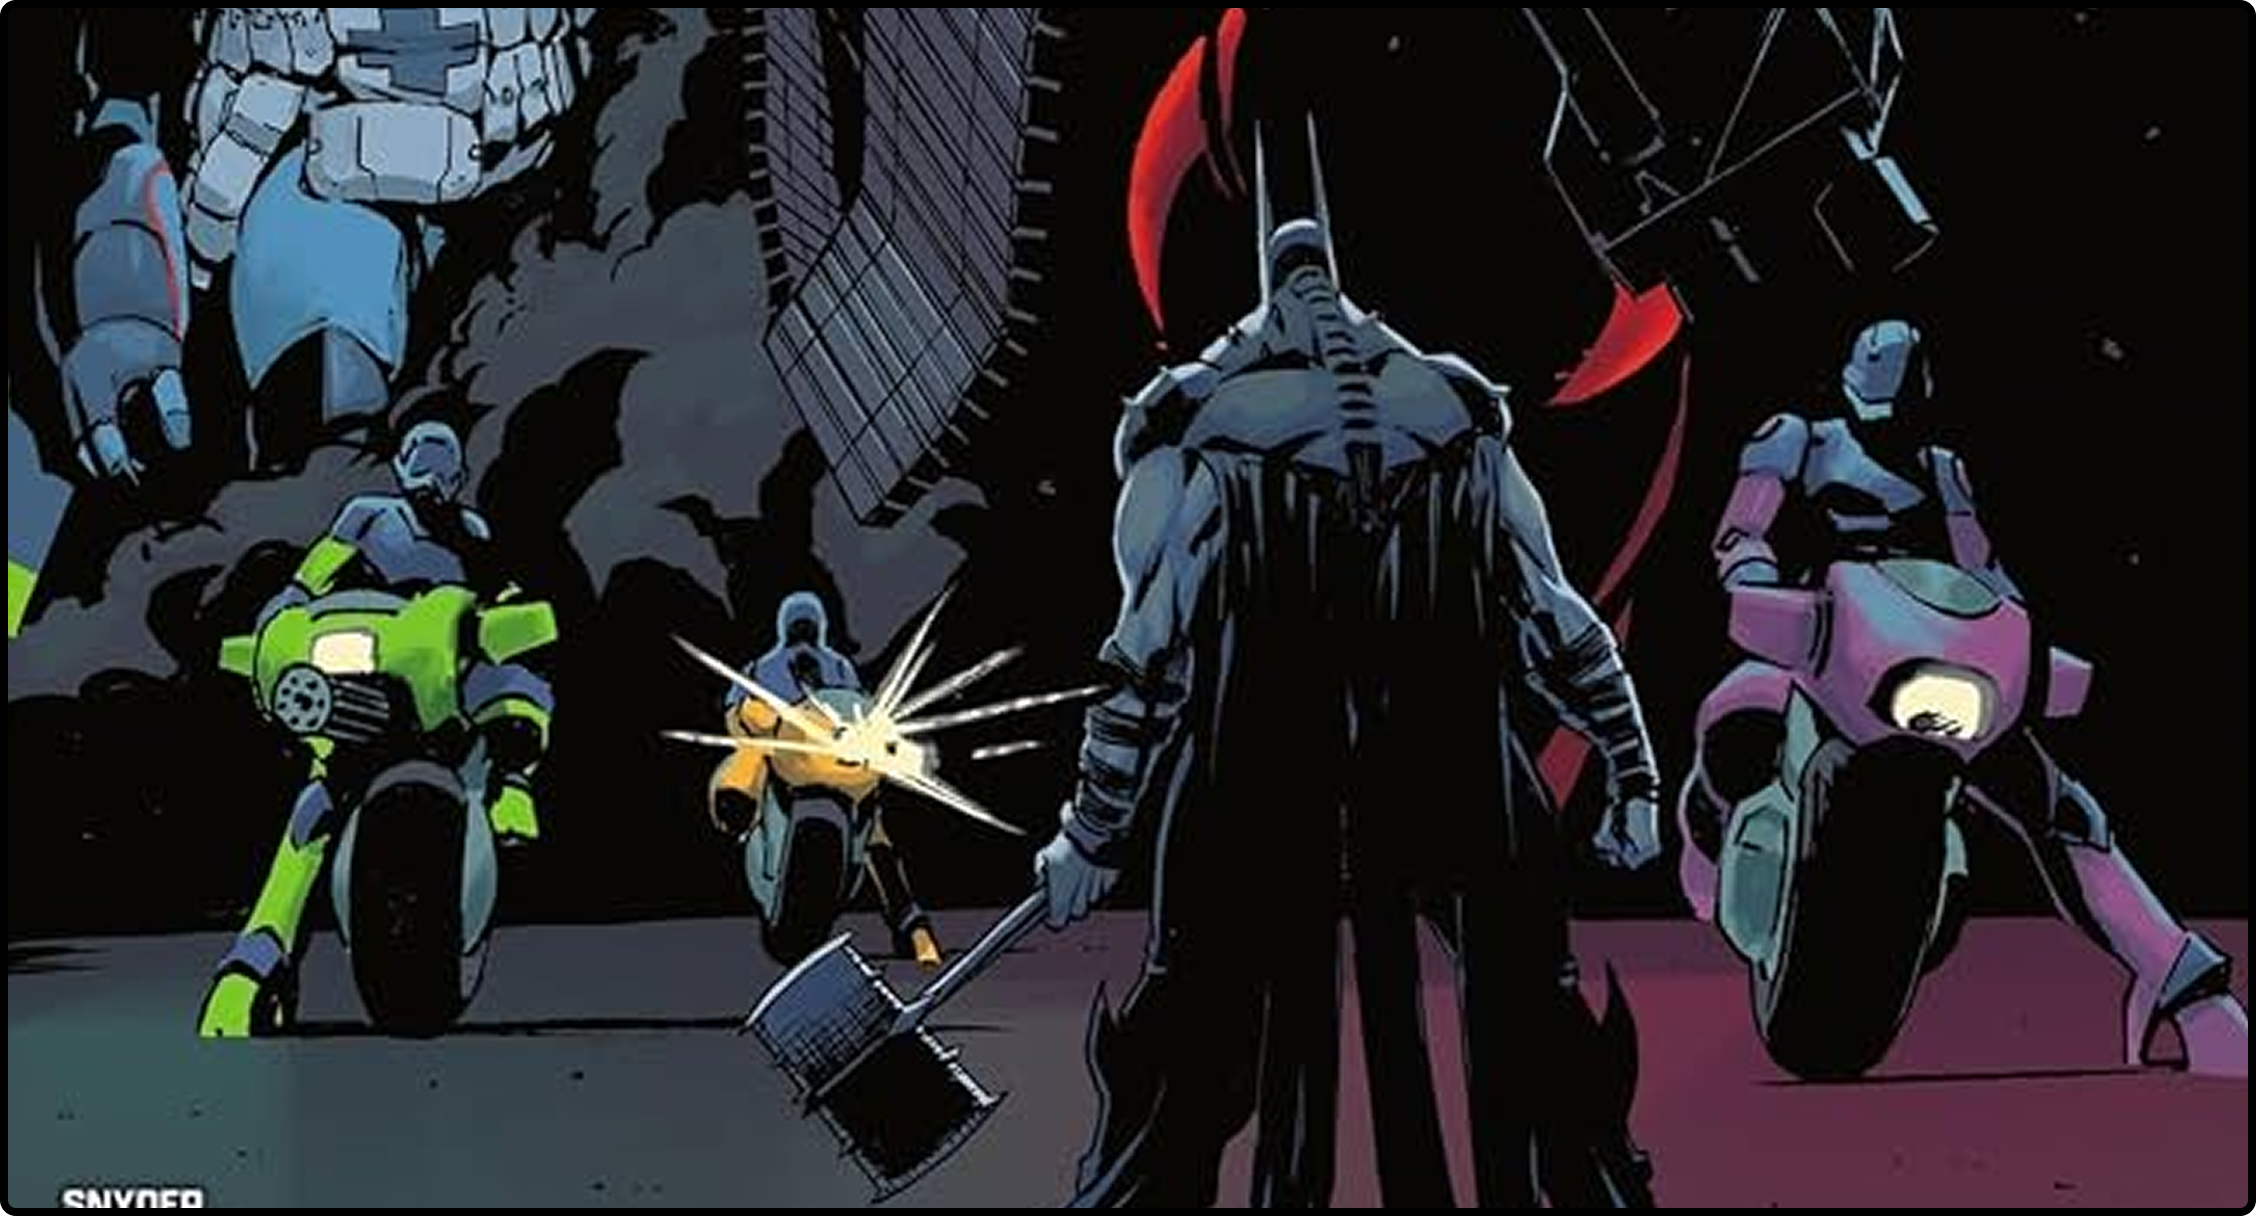
Look beneath the hood, though, and the internal distribution tells a wild story. Absolute Batman alone pulled in an astonishing $207,878.
The drop-off after that is sheer cliff face:
Custom Hero Initiative Giant-Size X-Men: $26,917
Absolute Batman Ashcan: $24,225
Deviant Nation: $14,340
Amazing Spider-Man: $14,322
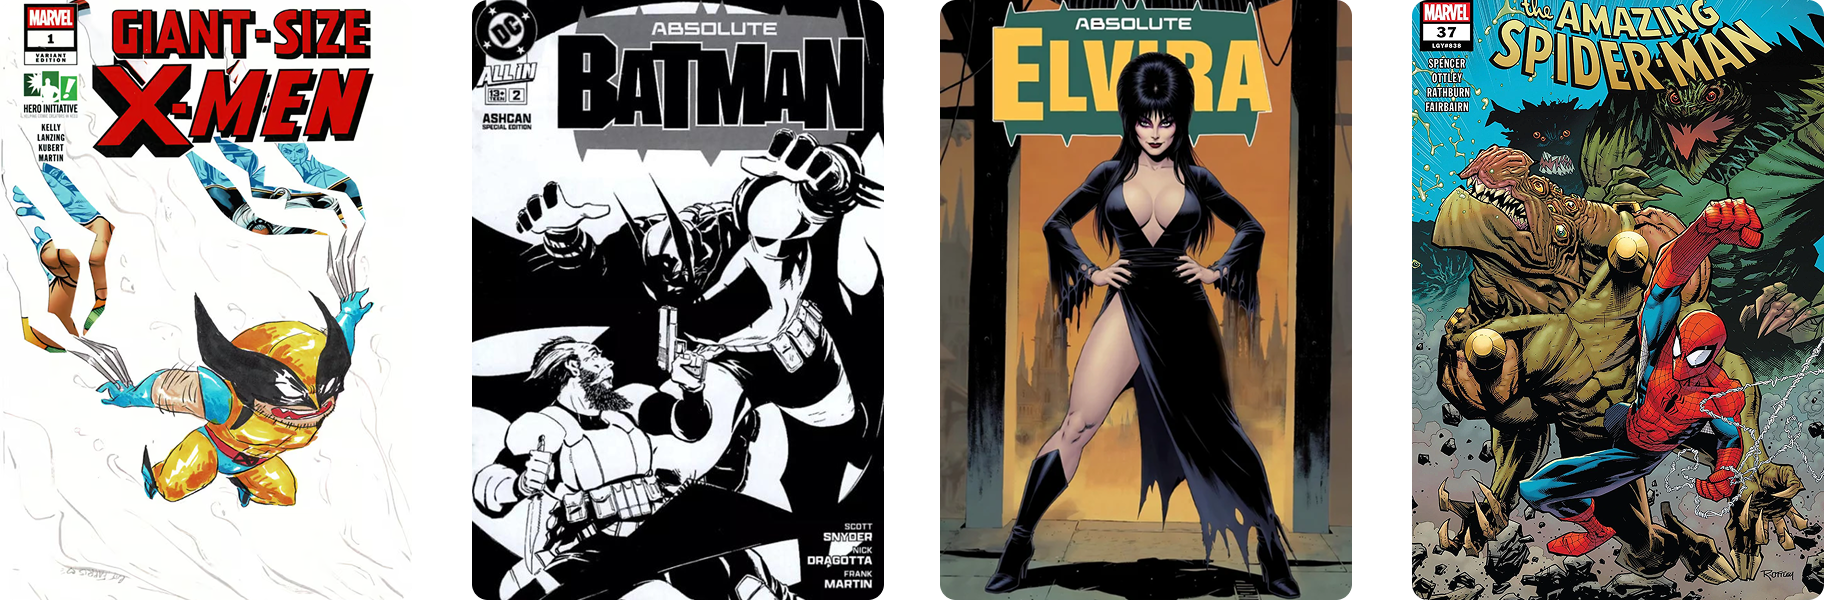
That means Absolute Batman accounted for roughly 72.3% of all dollars spent across the decade's top five performers. Rather than a broad, multi-title ecosystem, one single series effectively drove nearly three-quarters of the entire modern top tier. Same Rankings. Very Different Markets.
This distinction appears throughout the dataset. The 1940s are exceptionally distributed.
Batman led with $36,846, but Captain America Comics generated $36,329, Detective Comics $35,616 and Master Comics $33,483.
The decade’s #1 title accounted for only 21.8% of Top Five sales. Compare that with the 1950s. Sports Illustrated generated $91,256 from a Top Five total of $144,851. That’s 63.0%.
Or the 2000s. Invincible generated $42,461 from $73,855. That’s 57.5%. The headline total doesn’t tell you how the money underneath it is distributed.
Depth vs. Concentration
What we’re really looking at here are two completely different expressions of market strength.
The first is depth, where serious capital distributes naturally across multiple flagship titles at once. The 1960s serve as the textbook example in this dataset: strong demand across a wide bench, with no single book forced to carry the era's weight.
The second is concentration, where a single runaway property captures a disproportionate slice of the collector pie. The 2020s illustrate the extreme end of that spectrum, with Absolute Batman soaking up nearly all the oxygen in the room.
Neither pattern is inherently better or worse, but they tell wildly different stories about underlying collector behaviour. An era pulling in $775,433 spread across half a dozen blue-chip pillars represents a fundamentally different market dynamic than one where almost three out of every four dollars in the top-tier funnel into a single book.
That’s precisely why judging a market solely by top-line revenue misses the real story. Often, the most revealing insight isn’t just how much money was spent; it’s how far that capital had to travel to get there.