Depth vs Dominance: Two Very Different Comic Markets

The comic market can look strong in more than one way.
Sometimes strength comes from one title completely owning the conversation. Other times, it comes from several titles all attracting serious money at once. The September 8–21 Top of the Stack data gives us a particularly clear example of both.
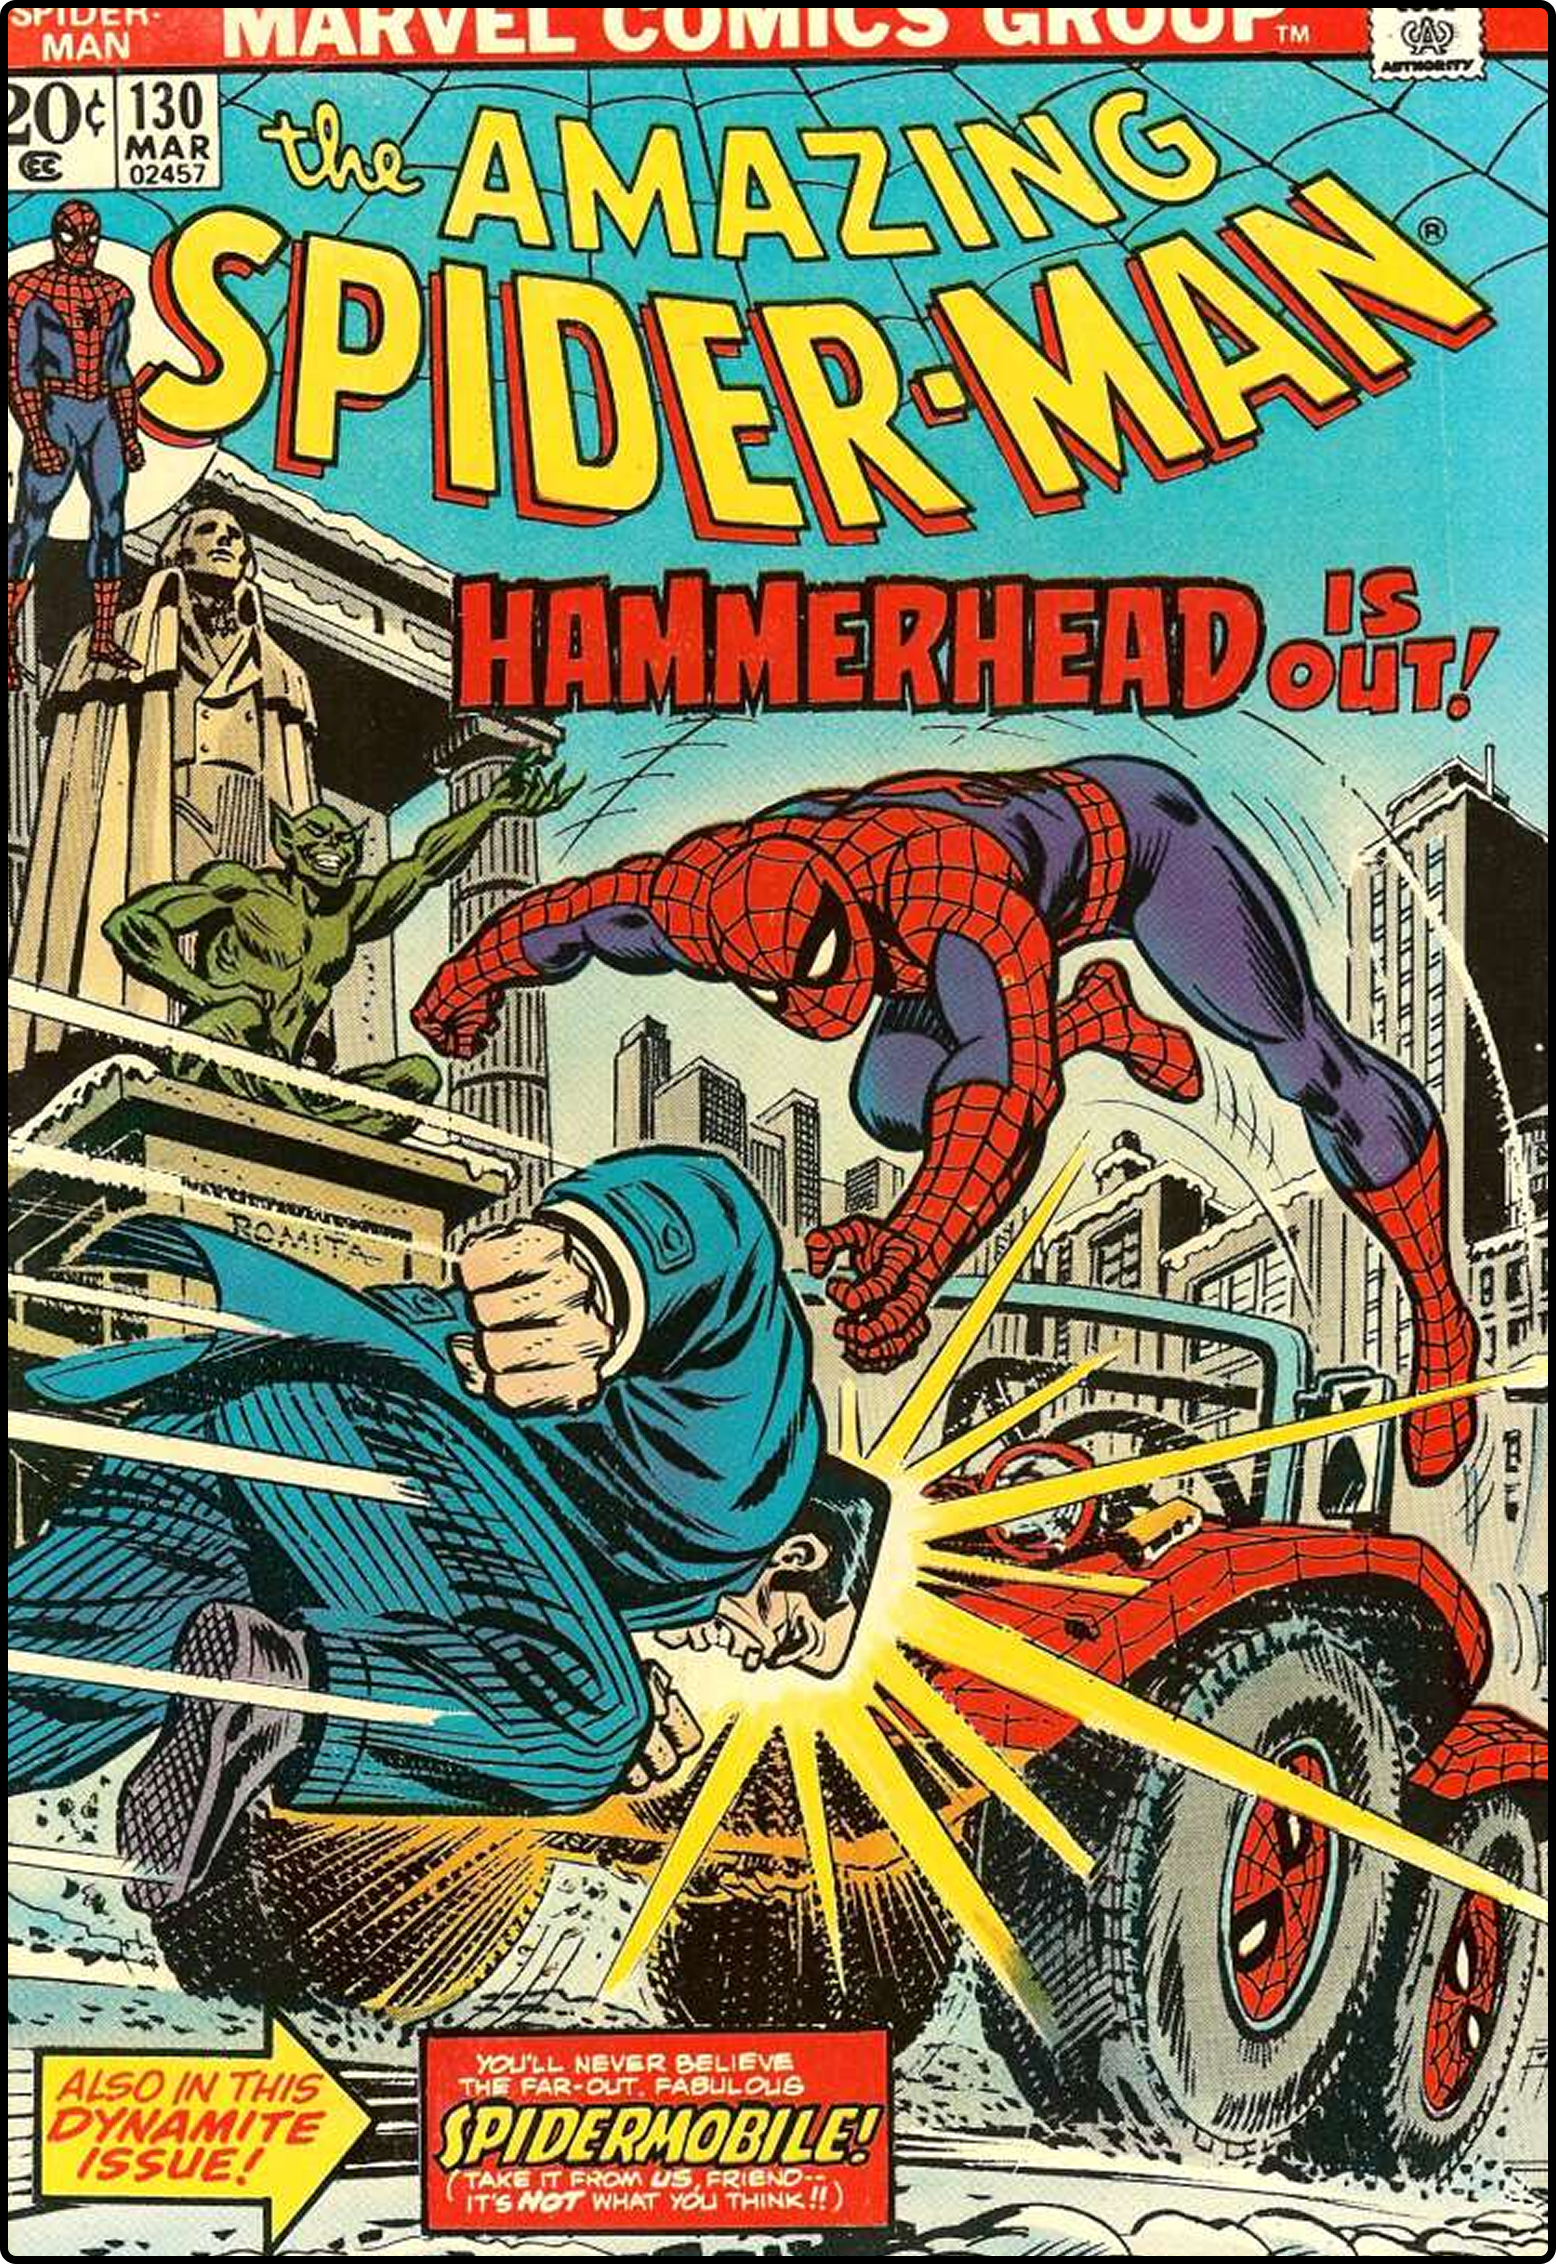
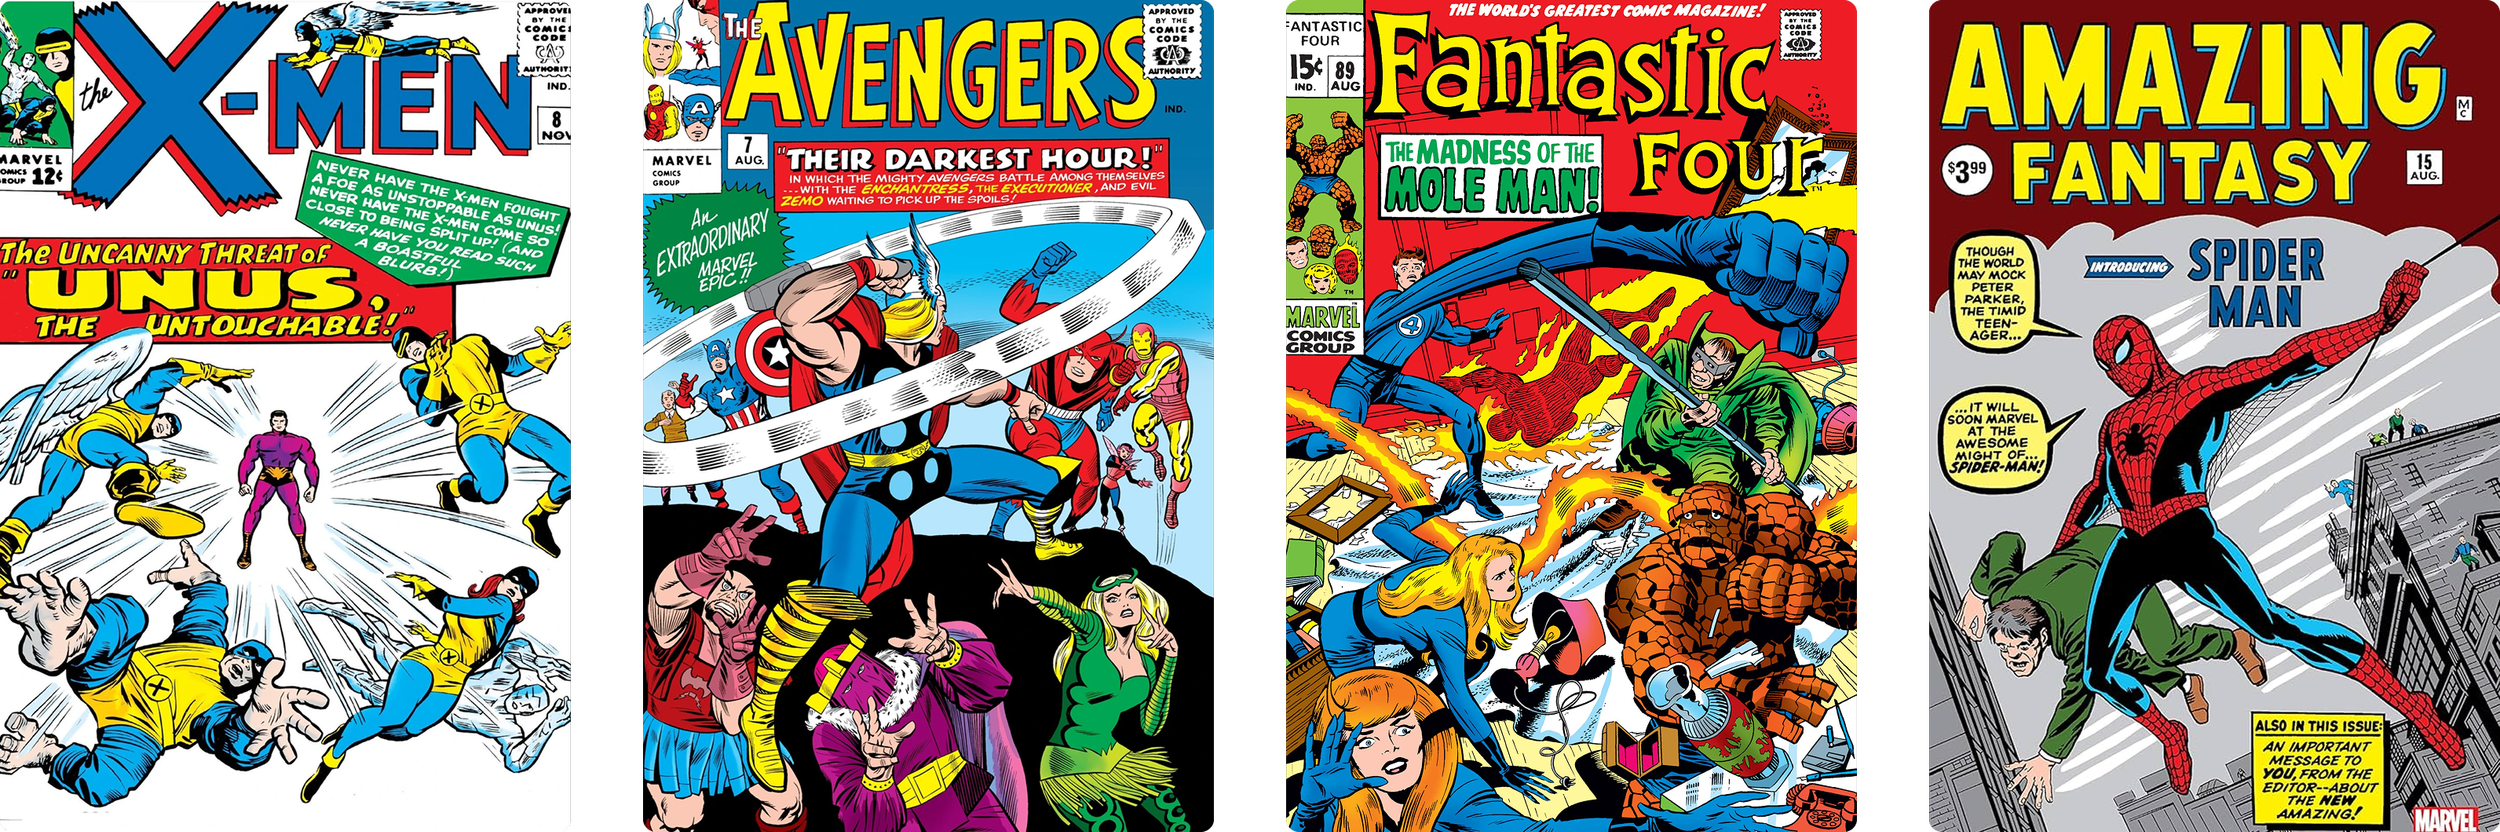
The 1960s generated $621,918 across its five highest-selling titles, comfortably the largest combined total of any decade in the dataset. Amazing Spider-Man led the group with $205,131, but it was hardly carrying the decade on its own. X-Men, Fantastic Four, Amazing Fantasy and Avengers were all attracting substantial spending alongside it.
The 2020s looked very different.
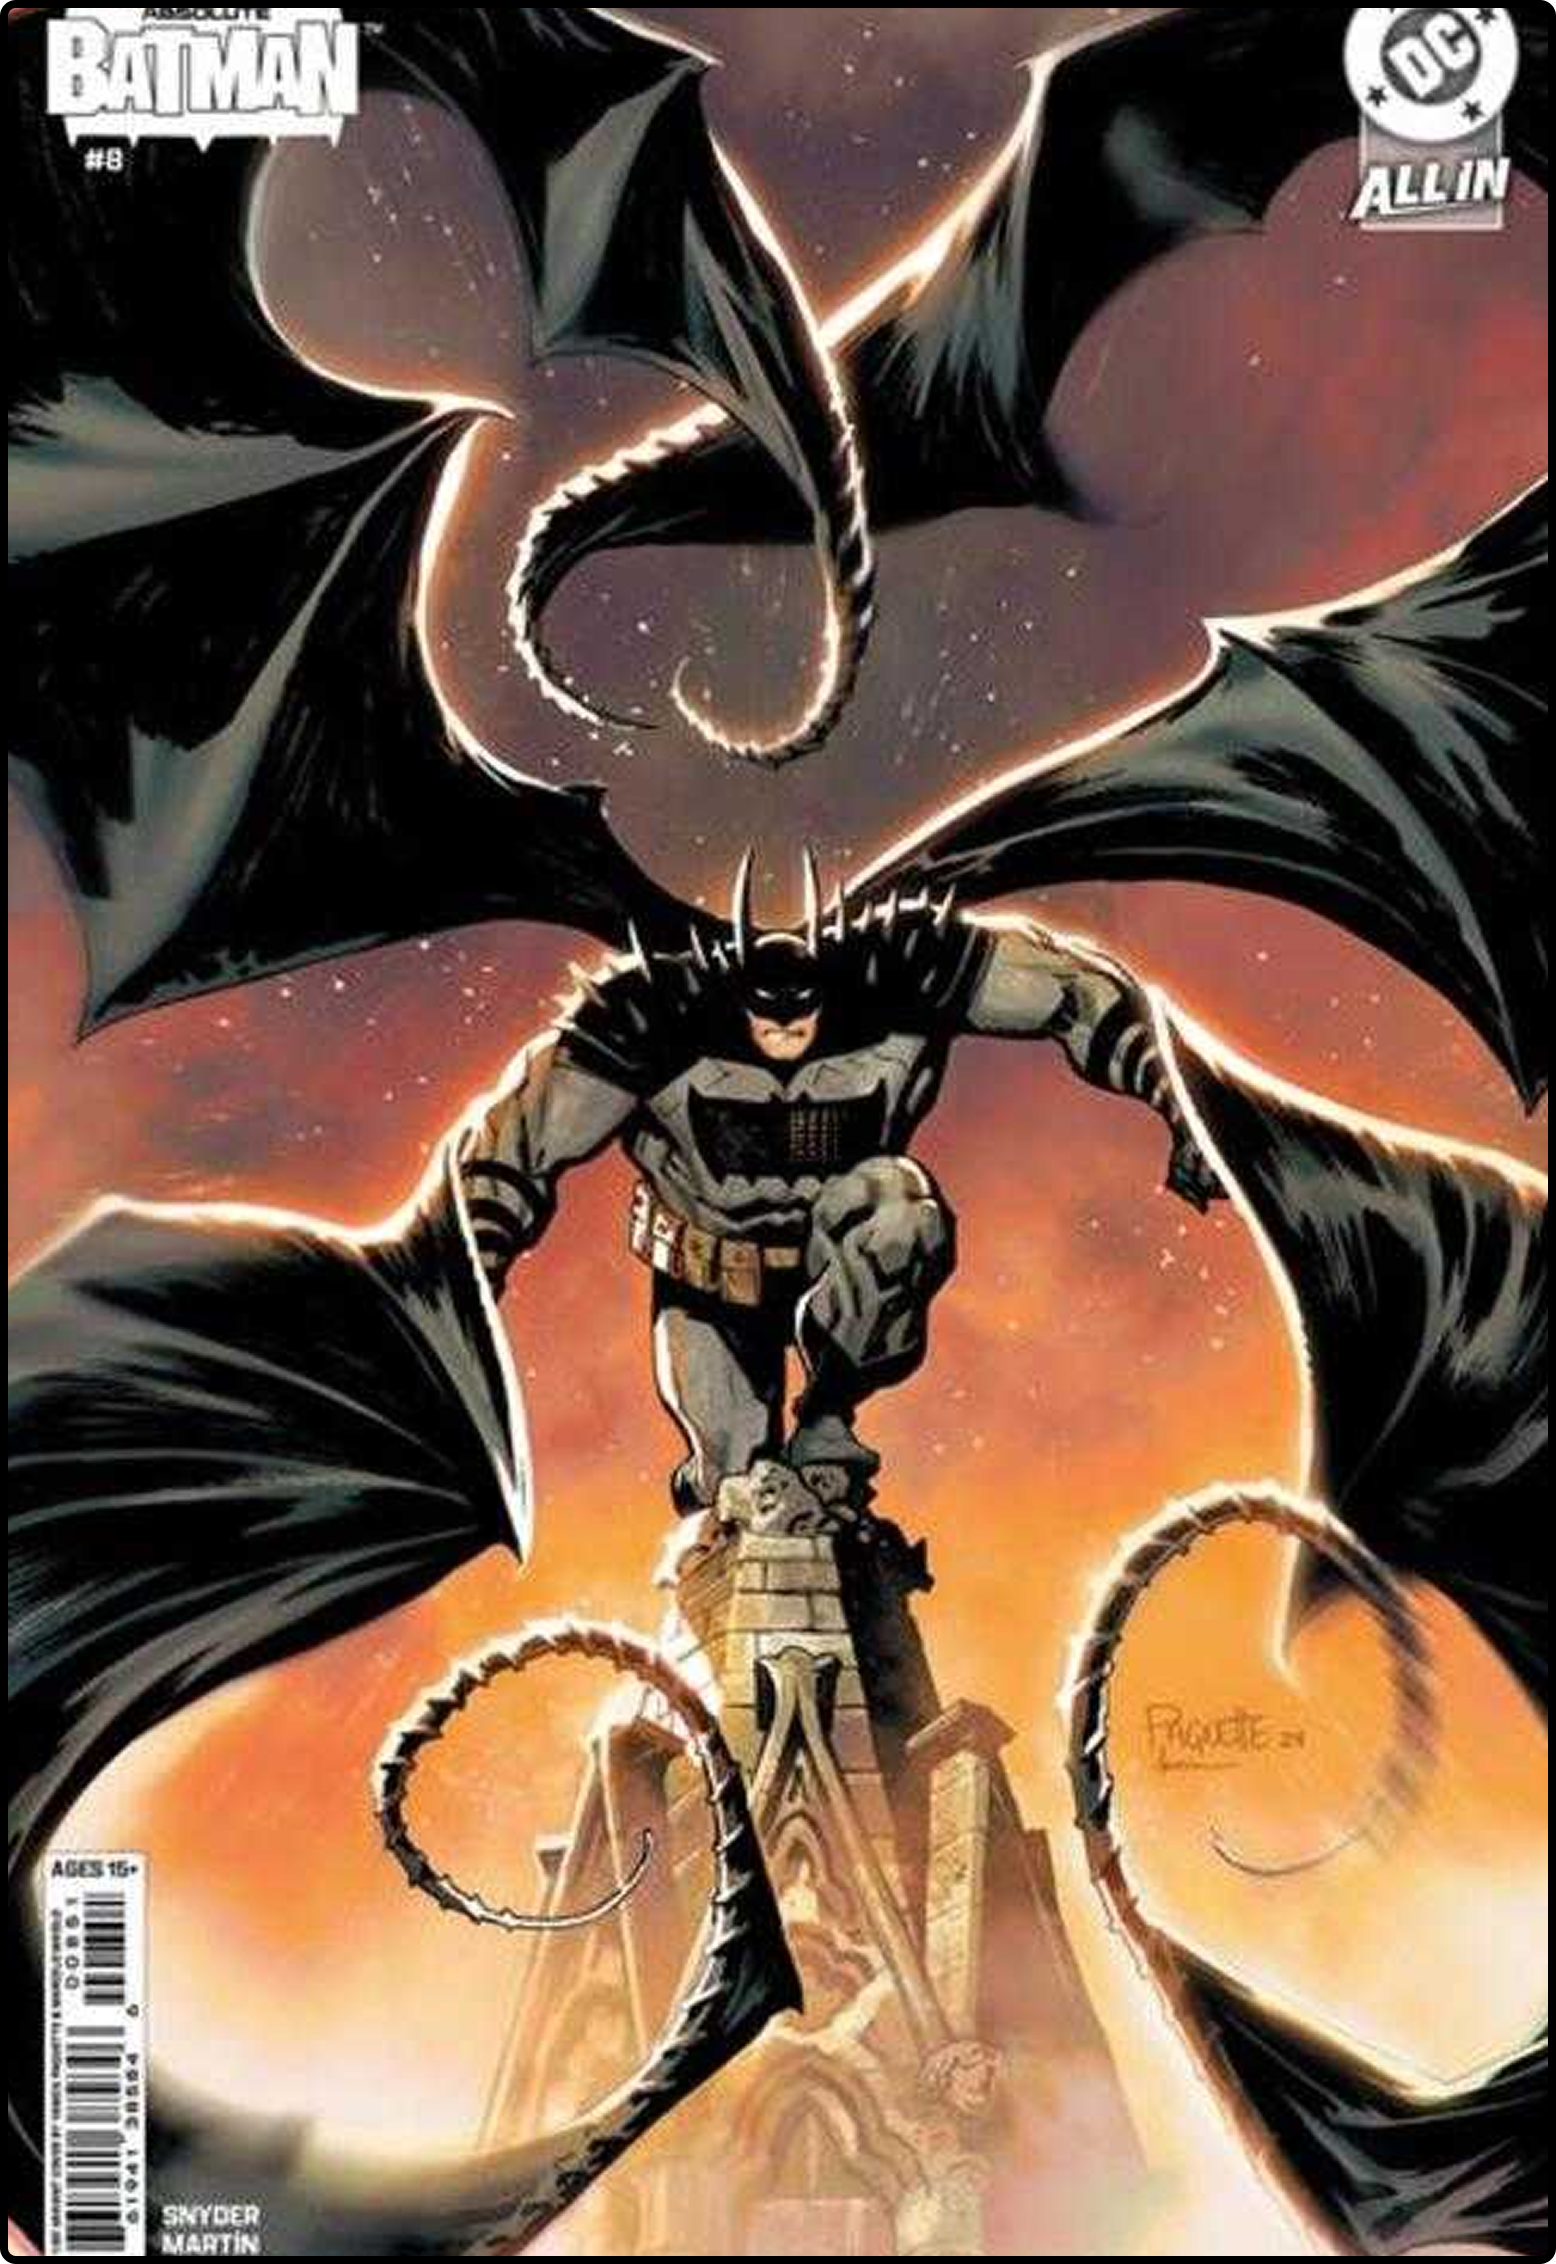
Its five highest-selling titles generated $259,249. That is still a sizeable amount of activity, but $210,710 of it came from one title: Absolute Batman.
Both decades had an obvious leader. What sits underneath those leaders, however, tells us two very different stories about the market.
What Remains When #1 Disappears?
Each decade compares its full Top Five title sales with the amount remaining after removing the highest-selling title. Dataset pooled during the September 8–21, 2026 reporting period.
$416,787
1960s sales remaining after removing Amazing Spider-Man
1960s
$416,787
Remove Amazing Spider-Man and the remaining four 1960s titles still generated more sales than the complete Top Five of every other decade in the dataset.
One leader of two completely different markets
Amazing Spider-Man accounted for 33% of the 1960s Top Five sales. Absolute Batman accounted for 81.3% of the 2020s.
That gap tells us far more than simply knowing which title ranked first.
Amazing Spider-Man was unquestionably the biggest player in the Silver Age group, but around two-thirds of the money still went elsewhere. X-Men generated $118,667, Fantastic Four $114,203, Amazing Fantasy $99,356 and Avengers another $84,561.
There was a leader, but it also had real weight behind it.
The 2020s were almost the reverse. Absolute Batman’s $210,710 was nearly 15 times the $14,200 generated by second-place Something is Killing the Children. Transformers followed at $12,407, Amazing Spider-Man at $11,874 and Invincible Universe: Battle Beast at $10,058.
There is no gentle decline from first to second. Absolute Batman sits in a completely different bracket from everything around it.
1960s leader share: 33.0%
2020s leader share: 81.3%
That is the difference between having a dominant title and having a title dominate almost the entire field.
Take the biggest title away
The contrast becomes even more revealing when we remove each decade’s biggest seller.
Take Amazing Spider-Man out of the 1960s, and X-Men, Fantastic Four, Amazing Fantasy and Avengers still combine for $416,787.
That figure alone is remarkable.
The entire Top Five of the 1980s generated $363,573. The 1970s generated $319,098. The 2020s generated $259,249.
In other words, even after removing its strongest title altogether, the remaining four 1960s titles would still generate more sales than the complete Top Five of every other decade in this dataset.
That is what depth looks like.
Now remove Absolute Batman from the 2020s.
Something is Killing the Children, Transformers, Amazing Spider-Man and Invincible Universe: Battle Beast are left with a combined $48,539.
So the comparison becomes:
1960s without Amazing Spider-Man: $416,787
2020s without Absolute Batman: $48,539
The remaining 1960s market is more than eight times larger. That doesn’t make one period inherently better than the other. It tells us where the strength is coming from. In the 1960s, several major properties were supporting the market at the same time. In the 2020s, the Top Five data was being driven overwhelmingly by one.
Absolute Batman’s dominance goes beyond one big sale
There is another reason the Absolute Batman result is interesting. This does not appear to be one enormous transaction distorting the numbers. Four of the five most-traded individual issues from the 2020s were Absolute Batman books: #1, #15, #20 and #19.
That matters because a title can dominate a dataset in different ways.
The 1950s give us a useful contrast. Showcase led that decade with $66,728 in sales, but a $45,000 sale of Showcase #13 CGC 9.6 drove much of that total. One extraordinary book had enough weight to shape the decade.
Absolute Batman looks different. Here, the activity spans several issues rather than concentrating in one trophy transaction.
That makes its 81.3% share more interesting. The concentration seems to be occurring at the title level, not simply at the level of a single exceptional comic.
Only three decades in the dataset had one title generate more than half of their Top Five sales: Showcase in the 1950s at 50.5%, Invincible in the 2000s at 55.1%, and Absolute Batman in the 2020s at 81.3%.
The percentages place them in the same broad category, but the behaviour underneath them is very different.
Showcase was heavily influenced by one major sale. Invincible led the 2000s despite not placing a single issue among that decade’s five most-traded individual books. Absolute Batman dominated both the title and individual-issue rankings.
Same idea on paper. Very different collector behaviour underneath.
Then there are markets where the money is spread everywhere
The 1990s sit at the other end of the spectrum.
Spider-Man (1990–1998) led the decade with $35,025, but that represented only 26% of the Top Five total. Amazing Spider-Man followed closely at $30,364, New Mutants at $27,973, Spawn at $21,032 and Uncanny X-Men at $20,191. The gap between first and fifth is relatively small. Spider-Man generated only around 1.7 times as much as the fifth-ranked title.
By comparison, Absolute Batman generated almost 21 times as much as fifth-place Invincible Universe: Battle Beast. That doesn’t necessarily mean the 1990s market was stronger. Its overall dollar total was much smaller than the 1960s, 1970s or 1980s. What it does show is that spending was distributed much more evenly among the leading titles.
And this is where simply looking at who ranked #1 starts to become limiting.
A title can be #1 because it narrowly leads a competitive group. It can be #1 because one exceptional sale pushed it to the top. Or it can be #1 because it has left everything else in the decade behind.
The ranking looks the same. The market underneath it does not.
Looking beyond the leaderboard
The 1960s stood out so strongly in this dataset. Amazing Spider-Man was the biggest-selling title, but it wasn’t the whole market. X-Men, Fantastic Four, Amazing Fantasy and Avengers collectively generated more than twice ASM’s sales.
Remove Spider-Man altogether, and $416,787 still sits underneath it.
That is a very different kind of strength from what we see in the 2020s, where Absolute Batman is responsible for more than four-fifths of the Top Five total.
One market has a superstar surrounded by other heavyweights.
The other has a superstar far ahead.
Both can produce impressive headline numbers. But once you look beneath those numbers, they tell very different stories about where collectors are actually putting their money.
And perhaps that is the more useful way to read these rankings.
Not simply: Who finished first?
But: How much of the market is still standing once you take them away?